


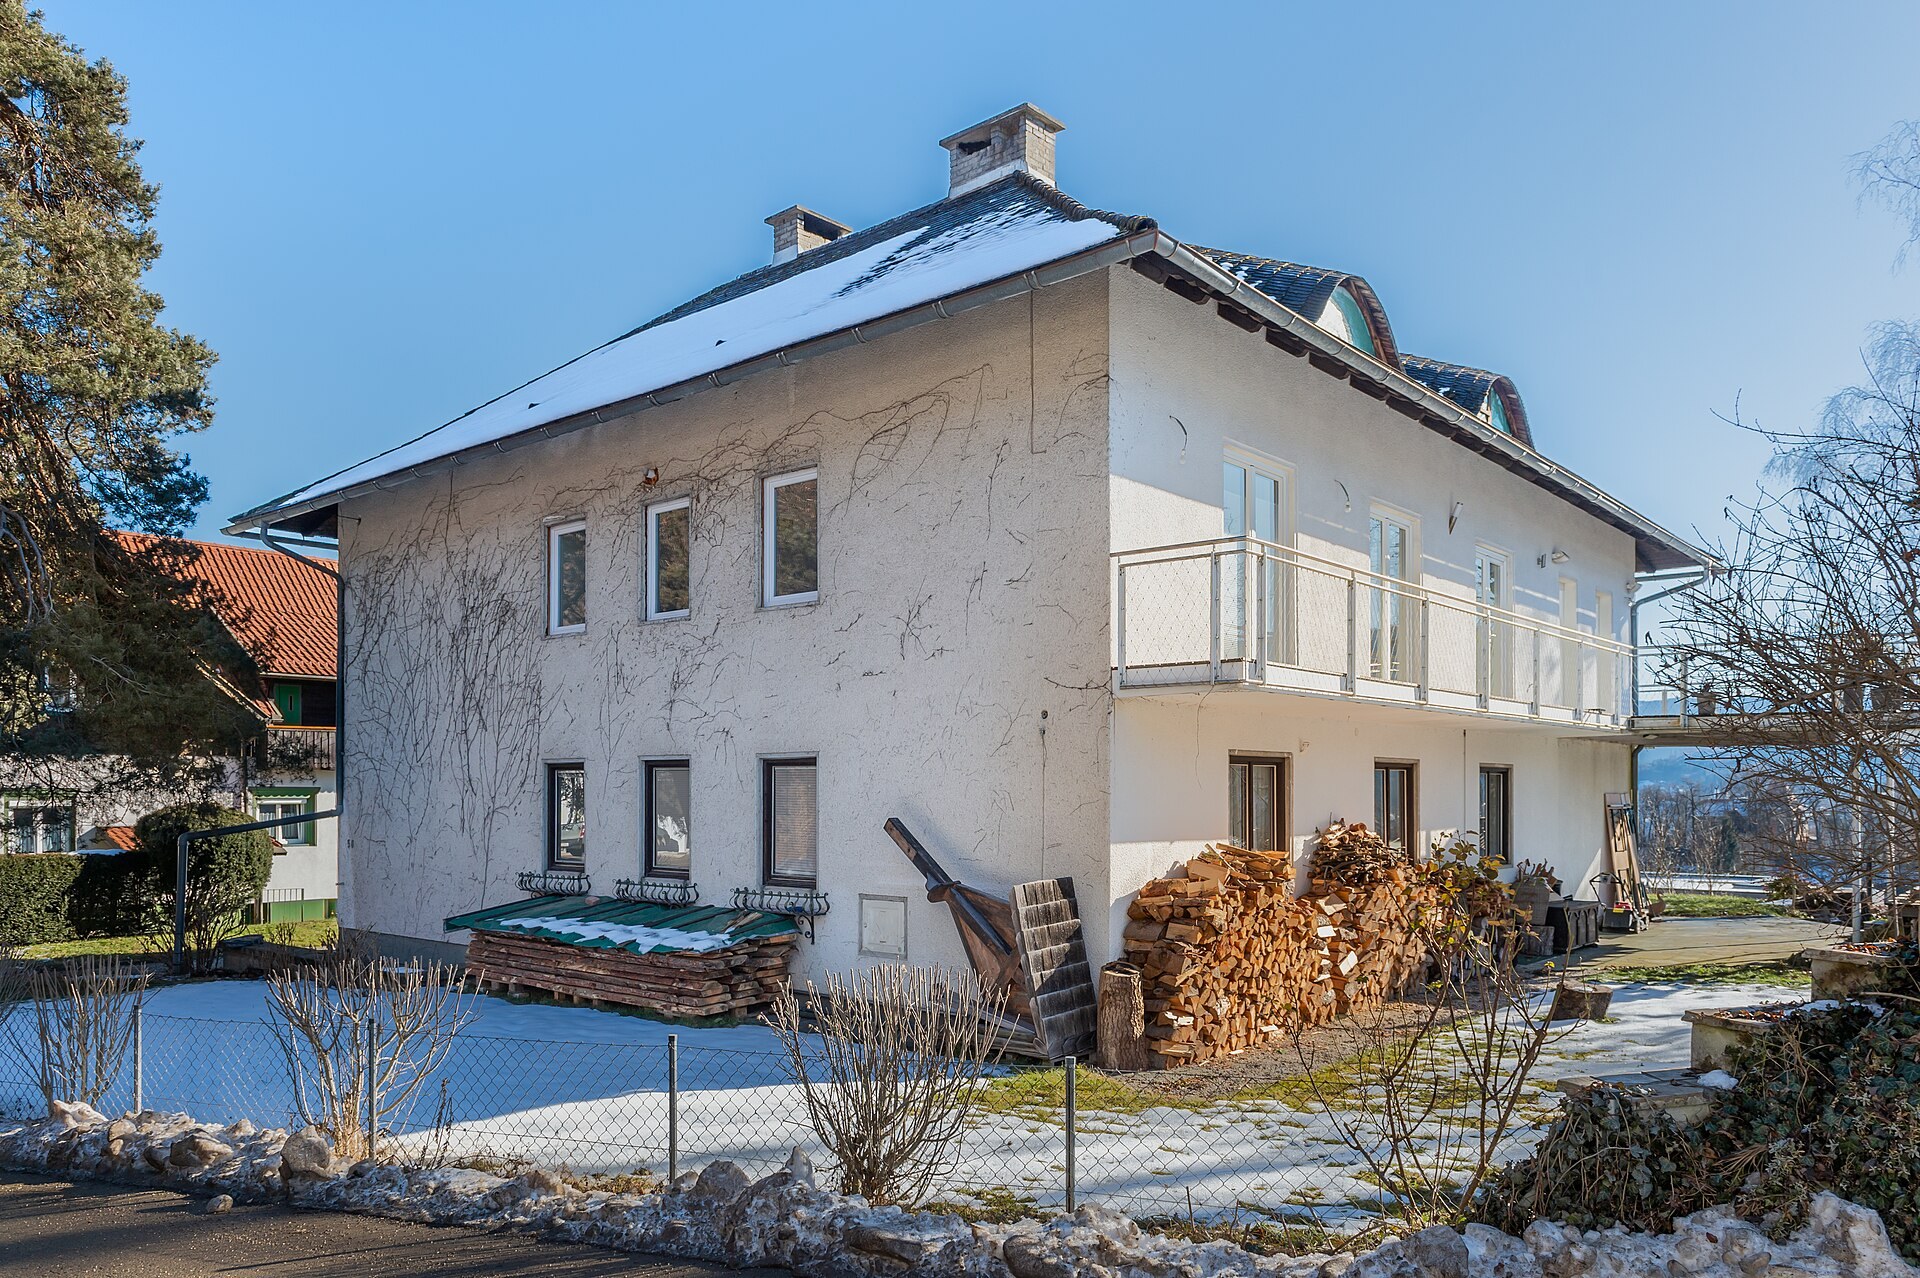
A house does not have a heating bill so much as a heat loss, multiplied by a winter. Heating degree days measure the winter half of that: how far below comfortable the outside air sat, and for how long. One number, summed day by day, and it is the climate figure a wood pile, a propane tank or a heat pump actually responds to.
Below is the annual figure for the 48 contiguous US states and 30 European countries on both official bases, mapped and tabulated, then the arithmetic that turns it into a winter fuel order.
Key number
The contiguous United States averaged 4,262 heating degree days a year on the 65°F base across 1991–2020, against 4,628 across 1961–1990 and 4,009 across 2015–2024. Eurostat’s figure for the 27 member countries moved the same way: 3,477 across 1980–1989, 3,163 across 1991–2020, 2,942 across 2015–2024.
All 78 places in this dataset had a milder recent decade than their own 1991–2020 normal, by a median of 6%. The spread between them is far larger than the trend: North Dakota carries 14 times the degree days of Florida.
In this dataset
What a Degree Day Counts
Take one day’s mean outdoor temperature. Subtract it from a fixed base temperature. If the answer is positive, that is the day’s heating degree days. Sum the year and you have the annual figure.
The base is not a comfort setting. It stands for the outdoor temperature at which a building stops needing heat, because body heat, cooking, lighting and daylight already cover the loss. Older housing stock balanced out near 65°F, which is where the American convention comes from.
The two authorities on this page do not count the same way, and that matters more than the unit does.
| NOAA, United States | Eurostat, Europe | |
|---|---|---|
| Base temperature | 65°F (18.3°C) | 18°C (64.4°F) |
| Days counted | Every day the mean falls below the base | Only days whose mean is 15°C or lower |
| Daily mean | Midpoint of the day’s high and low | Daily mean air temperature on a 25 km grid |
| Combined by | Population weight within each state, 2010 Census | Grid cells averaged up to NUTS-3 regions |
| Unit | Degree Fahrenheit days | Degree Celsius days |
The unit conversion is simple arithmetic: one degree Fahrenheit day is five ninths of a degree Celsius day. Both columns are printed for every row in the table below, so nobody has to do it.
The counting rule is the part that does not convert. A day averaging 16°C scores 4.2 degree Fahrenheit days under the American rule — 2.3 in Celsius terms — and exactly zero under the European one, because 16 sits above the 15°C gate. Across a mild Atlantic autumn those days add up.
So a European figure carried into Fahrenheit reads slightly colder than it would have if the American rule had been applied to the same weather. Finland’s 5,557 degree Celsius days become 10,003 in Fahrenheit terms, ahead of North Dakota’s 9,184, and that gap is real rather than an artifact.
From Degree Days to Kilowatt-Hours
Steady-state heat loss is one line of physics: watts out equals the shell’s heat loss coefficient times the temperature difference across it. Hold that over a whole season and the temperature difference, integrated, is the degree-day total.
Winter heat (kWh) = UA (W/K) × 24 × HDD (°C·days) ÷ 1,000
UA is the whole-house heat loss coefficient: walls, roof, floor, glass and air leakage added together. Nobody knows theirs without a survey, so it is normally estimated from floor area and a shell factor.
| Building shell | Btu/hr per sq ft per °F | W per m² per K | What it looks like |
|---|---|---|---|
| Old and leaky, little insulation | 0.30 | 1.70 | Solid wall or uninsulated frame, single glazing, drafty |
| Average existing house | 0.20 | 1.14 | Loft insulation, double glazing, ordinary air sealing |
| Well insulated and tight | 0.12 | 0.68 | Deep retrofit or a build to a current energy code |
| Very tight modern build | 0.07 | 0.40 | Thick continuous insulation, triple glazing, blower-door tested |
The same four bands drive the winter-wood calculator on the firewood BTU chart, so the two pages agree with each other by construction.
A 1,615 square foot house of average construction in Ohio: 1,615 × 0.20 gives a UA of 323 Btu per hour per °F. Multiply by 24 hours and by Ohio’s 5,689 degree days and the winter needs 44.1 million Btu, or 12,900 kWh of delivered heat.
A 150 square meter house of average construction in Germany: 150 × 1.14 gives a UA of 170 watts per kelvin. Multiply by 24 hours and by Germany’s 3,104 degree days and the winter needs 12,700 kWh of delivered heat.
Those two houses are the same house, and the two climates are within 2% of each other. Ohio and Germany run almost identical winters once both are put on one scale, which is the whole reason for printing both bases side by side.
One warning about the bottom band. The degree-day method gives no credit for sunshine through the windows or the heat thrown off by people, cooking and appliances. In a leaky house those gains are lost almost as fast as they appear; in a very tight one they cover a real share of the winter, so the method reads high exactly where the building is best. Treat the 0.07 row as a ceiling rather than a forecast.
Both Continents on One Scale
Both maps are shaded on one scale: annual heating degree days on the 18°C base, 1991–2020. US state figures are the NOAA 65°F totals converted at five ninths, so the two continents can be read against each other on sight.
under 1,0001,000 – 2,0002,000 – 3,0003,000 – 4,0004,000 – 5,0005,000 and overno figure in this dataset
The American map is a north-to-south gradient bent by altitude. New Mexico, at 4,462 on the 65°F base, carries a third more degree days than North Carolina, at 3,359, while sitting slightly further south; the difference is elevation.
Europe’s map is bent by the ocean instead. Ireland, at 2,785 on the 18°C base, is milder than Slovakia, at 3,327, while sitting further north. The Atlantic keeps the western edge of the continent several hundred degree days warmer than the same latitude inland.
Your Winter in Cords, Pellets and Propane
Pick a place, set the floor area and the shell, and this converts the degree-day figure into a fuel order. Heat delivered to the room, then divided by what each fuel carries and by how much of that heat the appliance actually releases into the house.
HEAT NEEDED
0 kWh per winter
FIREWOOD
0 cords
SAME WOOD, METRIC
0 steres
PELLETS
0 kg
PROPANE
0 gallons
HEAT PUMP
0 kWh of electricity
Firewood at 20 million Btu per cord, the figure the US Energy Information Administration publishes for a cord, in an appliance assumed to put 70% of the fuel heat into the room. Pellets at 4.8 kWh per kilogram net — 17.3 GJ per tonne at 10% moisture, from the UK Government’s 2025 conversion-factor methodology — in an appliance assumed 85% efficient.
Propane at 91,452 Btu per gallon, the EIA figure, in a furnace assumed 90% efficient. The heat pump runs at an assumed seasonal coefficient of performance of 2.5, a planning figure rather than a nameplate rating.
Firewood at 20 million Btu per cord, the figure the US Energy Information Administration publishes for a cord, in an appliance assumed to put 70% of the fuel heat into the room. Pellets at 4.8 kWh per kilogram net — 17.3 GJ per tonne at 10% moisture, from the UK Government’s 2025 conversion-factor methodology — in an appliance assumed 85% efficient.
Propane at 91,452 Btu per gallon, the EIA figure, which is 7.08 kWh per liter, in a furnace assumed 90% efficient. The heat pump runs at an assumed seasonal coefficient of performance of 2.5, a planning figure rather than a nameplate rating.
The heat-pump row is the one worth staring at. The Ohio winter above, 12,900 kWh of delivered heat, comes to about 5,200 kWh of electricity at an assumed seasonal coefficient of performance of 2.5. That is what an off-grid system has to make in the darkest months of the year.
The heat-pump row is the one worth staring at. The German winter above, 12,700 kWh of delivered heat, comes to about 5,100 kWh of electricity at an assumed seasonal coefficient of performance of 2.5. That is what an off-grid system has to make in the darkest months of the year.
Run it through the off-grid house calculator before assuming a battery bank can carry it, and check the panel side against the peak sun hours atlas, where December is the month that sizes the array.
Every State and Country
The 48 contiguous US states first, then 30 European countries, alphabetically within each group. Tap any column heading to re-sort, including across both groups at once.
The two degree-day columns are the same number in different units. The winter heat and cord columns are for one fixed reference house — 150 square meters, or 1,615 square feet, of average existing construction — so the columns rank climates rather than describing any particular building.
| Location | HDD, base 65°F | HDD, base 18°C | Last decade vs normal | Reference house, kWh | Cords |
|---|---|---|---|---|---|
| Alabama US state · NOAA base 65°F | 2,669 | 1,483 | -11.2% | 6,063 | 1.5 |
| Arizona US state · NOAA base 65°F | 1,919 | 1,066 | -4.7% | 4,358 | 1.1 |
| Arkansas US state · NOAA base 65°F | 3,391 | 1,884 | -6.4% | 7,703 | 1.9 |
| California US state · NOAA base 65°F | 2,814 | 1,564 | -5.9% | 6,394 | 1.6 |
| Colorado US state · NOAA base 65°F | 7,053 | 3,918 | -2.5% | 16,018 | 3.9 |
| Connecticut US state · NOAA base 65°F | 5,849 | 3,249 | -5.9% | 13,283 | 3.2 |
| Delaware US state · NOAA base 65°F | 4,483 | 2,491 | -6.1% | 10,184 | 2.5 |
| Florida US state · NOAA base 65°F | 646 | 359 | -21.2% | 1,468 | 0.4 |
| Georgia US state · NOAA base 65°F | 2,807 | 1,560 | -11.3% | 6,378 | 1.6 |
| Idaho US state · NOAA base 65°F | 6,870 | 3,817 | -2.4% | 15,605 | 3.8 |
| Illinois US state · NOAA base 65°F | 6,105 | 3,391 | -4.8% | 13,864 | 3.4 |
| Indiana US state · NOAA base 65°F | 5,628 | 3,127 | -5.6% | 12,784 | 3.1 |
| Iowa US state · NOAA base 65°F | 6,822 | 3,790 | -4.2% | 15,495 | 3.8 |
| Kansas US state · NOAA base 65°F | 4,876 | 2,709 | -5.1% | 11,075 | 2.7 |
| Kentucky US state · NOAA base 65°F | 4,397 | 2,443 | -7.0% | 9,988 | 2.4 |
| Louisiana US state · NOAA base 65°F | 1,654 | 919 | -12.8% | 3,757 | 0.9 |
| Maine US state · NOAA base 65°F | 7,758 | 4,310 | -4.8% | 17,621 | 4.3 |
| Maryland US state · NOAA base 65°F | 4,563 | 2,535 | -6.6% | 10,364 | 2.5 |
| Massachusetts US state · NOAA base 65°F | 6,132 | 3,407 | -6.1% | 13,929 | 3.4 |
| Michigan US state · NOAA base 65°F | 6,745 | 3,747 | -6.0% | 15,319 | 3.7 |
| Minnesota US state · NOAA base 65°F | 8,534 | 4,741 | -3.6% | 19,383 | 4.7 |
| Mississippi US state · NOAA base 65°F | 2,389 | 1,327 | -11.6% | 5,425 | 1.3 |
| Missouri US state · NOAA base 65°F | 4,980 | 2,767 | -5.6% | 11,313 | 2.8 |
| Montana US state · NOAA base 65°F | 8,550 | 4,750 | -2.2% | 19,420 | 4.7 |
| Nebraska US state · NOAA base 65°F | 6,281 | 3,490 | -3.9% | 14,268 | 3.5 |
| Nevada US state · NOAA base 65°F | 3,452 | 1,918 | -3.1% | 7,842 | 1.9 |
| New Hampshire US state · NOAA base 65°F | 7,449 | 4,138 | -5.2% | 16,918 | 4.1 |
| New Jersey US state · NOAA base 65°F | 5,168 | 2,871 | -6.1% | 11,738 | 2.9 |
| New Mexico US state · NOAA base 65°F | 4,462 | 2,479 | -4.7% | 10,135 | 2.5 |
| New York US state · NOAA base 65°F | 6,001 | 3,334 | -5.6% | 13,631 | 3.3 |
| North Carolina US state · NOAA base 65°F | 3,359 | 1,866 | -8.6% | 7,629 | 1.9 |
| North Dakota US state · NOAA base 65°F | 9,184 | 5,102 | -2.8% | 20,859 | 5.1 |
| Ohio US state · NOAA base 65°F | 5,689 | 3,160 | -6.7% | 12,919 | 3.1 |
| Oklahoma US state · NOAA base 65°F | 3,535 | 1,964 | -5.9% | 8,030 | 2.0 |
| Oregon US state · NOAA base 65°F | 5,269 | 2,927 | -3.5% | 11,967 | 2.9 |
| Pennsylvania US state · NOAA base 65°F | 5,701 | 3,167 | -5.7% | 12,948 | 3.2 |
| Rhode Island US state · NOAA base 65°F | 5,761 | 3,200 | -5.8% | 13,083 | 3.2 |
| South Carolina US state · NOAA base 65°F | 2,587 | 1,437 | -10.3% | 5,875 | 1.4 |
| South Dakota US state · NOAA base 65°F | 7,633 | 4,240 | -2.5% | 17,335 | 4.2 |
| Tennessee US state · NOAA base 65°F | 3,754 | 2,085 | -7.8% | 8,524 | 2.1 |
| Texas US state · NOAA base 65°F | 1,818 | 1,010 | -8.8% | 4,129 | 1.0 |
| Utah US state · NOAA base 65°F | 6,979 | 3,877 | -3.1% | 15,851 | 3.9 |
| Vermont US state · NOAA base 65°F | 8,058 | 4,477 | -4.7% | 18,304 | 4.5 |
| Virginia US state · NOAA base 65°F | 4,259 | 2,366 | -7.1% | 9,673 | 2.4 |
| Washington US state · NOAA base 65°F | 5,610 | 3,117 | -3.0% | 12,743 | 3.1 |
| West Virginia US state · NOAA base 65°F | 5,067 | 2,815 | -6.4% | 11,509 | 2.8 |
| Wisconsin US state · NOAA base 65°F | 7,529 | 4,183 | -4.6% | 17,102 | 4.2 |
| Wyoming US state · NOAA base 65°F | 8,225 | 4,569 | -2.1% | 18,680 | 4.5 |
| Austria Country · Eurostat base 18°C | 6,563 | 3,646 | -7.7% | 14,906 | 3.6 |
| Belgium Country · Eurostat base 18°C | 4,882 | 2,712 | -6.1% | 11,088 | 2.7 |
| Bulgaria Country · Eurostat base 18°C | 4,765 | 2,647 | -10.4% | 10,822 | 2.6 |
| Croatia Country · Eurostat base 18°C | 4,320 | 2,400 | -9.0% | 9,812 | 2.4 |
| Cyprus Country · Eurostat base 18°C | 1,444 | 802 | -16.7% | 3,279 | 0.8 |
| Czechia Country · Eurostat base 18°C | 6,136 | 3,409 | -8.2% | 13,937 | 3.4 |
| Denmark Country · Eurostat base 18°C | 5,926 | 3,292 | -7.0% | 13,459 | 3.3 |
| Estonia Country · Eurostat base 18°C | 7,659 | 4,255 | -6.4% | 17,396 | 4.2 |
| Finland Country · Eurostat base 18°C | 10,003 | 5,557 | -4.3% | 22,719 | 5.5 |
| France Country · Eurostat base 18°C | 4,351 | 2,417 | -7.8% | 9,882 | 2.4 |
| Germany Country · Eurostat base 18°C | 5,587 | 3,104 | -8.5% | 12,690 | 3.1 |
| Greece Country · Eurostat base 18°C | 3,073 | 1,707 | -9.3% | 6,979 | 1.7 |
| Hungary Country · Eurostat base 18°C | 5,008 | 2,782 | -8.4% | 11,374 | 2.8 |
| Ireland Country · Eurostat base 18°C | 5,013 | 2,785 | -3.4% | 11,386 | 2.8 |
| Italy Country · Eurostat base 18°C | 3,652 | 2,029 | -7.9% | 8,295 | 2.0 |
| Latvia Country · Eurostat base 18°C | 7,346 | 4,081 | -6.9% | 16,685 | 4.1 |
| Lithuania Country · Eurostat base 18°C | 7,016 | 3,898 | -7.6% | 15,936 | 3.9 |
| Luxembourg Country · Eurostat base 18°C | 5,434 | 3,019 | -3.8% | 12,343 | 3.0 |
| Malta Country · Eurostat base 18°C | 943 | 524 | -12.6% | 2,142 | 0.5 |
| Netherlands Country · Eurostat base 18°C | 4,887 | 2,715 | -8.0% | 11,100 | 2.7 |
| Norway Country · Eurostat base 18°C | 9,927 | 5,515 | -2.8% | 22,547 | 5.5 |
| Poland Country · Eurostat base 18°C | 6,183 | 3,435 | -9.1% | 14,044 | 3.4 |
| Portugal Country · Eurostat base 18°C | 2,241 | 1,245 | -9.5% | 5,090 | 1.2 |
| Romania Country · Eurostat base 18°C | 5,517 | 3,065 | -9.8% | 12,531 | 3.0 |
| Slovakia Country · Eurostat base 18°C | 5,989 | 3,327 | -7.6% | 13,602 | 3.3 |
| Slovenia Country · Eurostat base 18°C | 5,173 | 2,874 | -7.1% | 11,750 | 2.9 |
| Spain Country · Eurostat base 18°C | 3,303 | 1,835 | -9.3% | 7,502 | 1.8 |
| Sweden Country · Eurostat base 18°C | 9,419 | 5,233 | -3.9% | 21,394 | 5.2 |
| Switzerland Country · Eurostat base 18°C | 6,919 | 3,844 | -6.7% | 15,716 | 3.8 |
| United Kingdom Country · Eurostat base 18°C | 5,483 | 3,046 | -4.8% | 12,453 | 3.0 |
Download the full table as CSV →
The CSV adds the 2015–2024 mean in both units and the reference house’s steres, pellet kilograms and propane in gallons and liters.
How These Numbers Were Made
US rows come from NOAA’s nClimDiv statewide heating degree-day series, element 25 of the statewide monthly file published by the National Centers for Environmental Information. Monthly values were summed by calendar year and averaged over 1991–2020, then again over 2015–2024.
The series is built from 5 km grid estimates interpolated from Global Historical Climatology Network station data, and its degree-day totals are population-weighted within each state on 2010 Census weights. NOAA calls these operational monitoring values, which can differ slightly from its official degree-day publications.
The file carries no rows for Alaska or Hawaii, and the District of Columbia is not one of its statewide units. All three are left out rather than estimated from a product built a different way.
European rows come from the Eurostat annual series nrg_chdd_a, indicator HDD, averaged over the same two windows. Eurostat interpolates roughly 3,000 station records onto a 25 km grid, then averages those cells up to NUTS-3 regions and on to countries.
Its rule is stated exactly: if the day’s mean air temperature is at or below 15°C, add 18°C minus that mean; otherwise add nothing. Norway, Switzerland and the United Kingdom appear in the series alongside the member countries and are included here.
The reference house is 150 square meters with a shell factor of 0.20 Btu per hour per square foot per °F, which is 1.14 watts per square meter per kelvin, giving a UA of 170 watts per kelvin. Winter heat is that UA times 24 hours times the degree-day figure, with no credit for solar or internal gains and no allowance for domestic hot water.
Fuel conversions use the Energy Information Administration’s published heat contents: 20 million Btu per cord of wood, 91,452 Btu per gallon of propane, 3,412 Btu per kilowatt-hour. A stere is one stacked cubic meter; a cord is 128 cubic feet, so one cord is 3.62 steres.
Pellets are taken at 4.8 kWh per kilogram net, the 17.3 GJ per tonne the UK Government’s 2025 greenhouse gas conversion-factor methodology lists for pellets at 10% moisture. Wetter pellets carry less.
The four appliance efficiencies are assumptions, set at seasonal averages rather than peak bench figures, and each is printed beside the output it drives. A different stove or furnace moves the fuel quantity in direct proportion.
Verified September 2026. NOAA nClimDiv statewide file climdiv-hddcst-v1.0.0-20260806 retrieved 2 September 2026. Eurostat nrg_chdd_a retrieved the same day, dataset last updated 8 May 2026. Both series are revised on their own schedules; the retrieval date is the date to quote.
Common Questions
Can I compare an American degree-day figure with a European one directly?
After the unit conversion, almost. Multiply degree Fahrenheit days by five ninths to get degree Celsius days.
What does not convert is the counting rule: Eurostat throws away every day whose mean sits above 15°C, so its totals are a little lower than the American method would give for the same weather. The gap is largest in mild maritime climates with long shoulder seasons and close to nothing in a hard continental winter.
Why is my own house so far off the reference figure?
Three reasons, in order of size. Floor area and shell quality between them move the answer by a factor of five across the four bands in the table above. Thermostat behavior moves it by a fifth in either direction. And a state or a country is not a site — the figures are population-weighted or grid-averaged, so a valley floor or a ridge at altitude can sit hundreds of degree days from the headline number.
Are winters getting shorter in this data?
Every one of the 78 places here recorded fewer degree days across 2015–2024 than across its own 1991–2020 normal, by a median of 6%. That is two overlapping windows rather than a trend line, and a single cold year still lands well above the average. For sizing a wood pile or a fuel tank, use the 1991–2020 normal and treat the recent decade as the reason not to build in extra margin on top.
Does this cover cooling?
No. Cooling degree days are a separate count against a base temperature, and both NOAA and Eurostat publish them in the same files used here. This page is the heating side, because that is the load that has to be met with stored fuel or stored electricity when the grid is not there.
Sources: NOAA National Centers for Environmental Information, nClimDiv statewide monthly heating degree days, file climdiv-hddcst-v1.0.0-20260806, and the accompanying statewide format documentation. Eurostat, Cooling and heating degree days by country, annual data (nrg_chdd_a), and its reference metadata for the calculation rule. US Energy Information Administration, Energy Explained: British thermal units, for the cord, propane and kilowatt-hour heat contents. UK Government, 2025 greenhouse gas reporting conversion factors, methodology paper Table 51, for the net calorific value of wood pellets. University of Maryland Extension FS926 and University of Arkansas FSA1091 for the cord convention used across this site.