


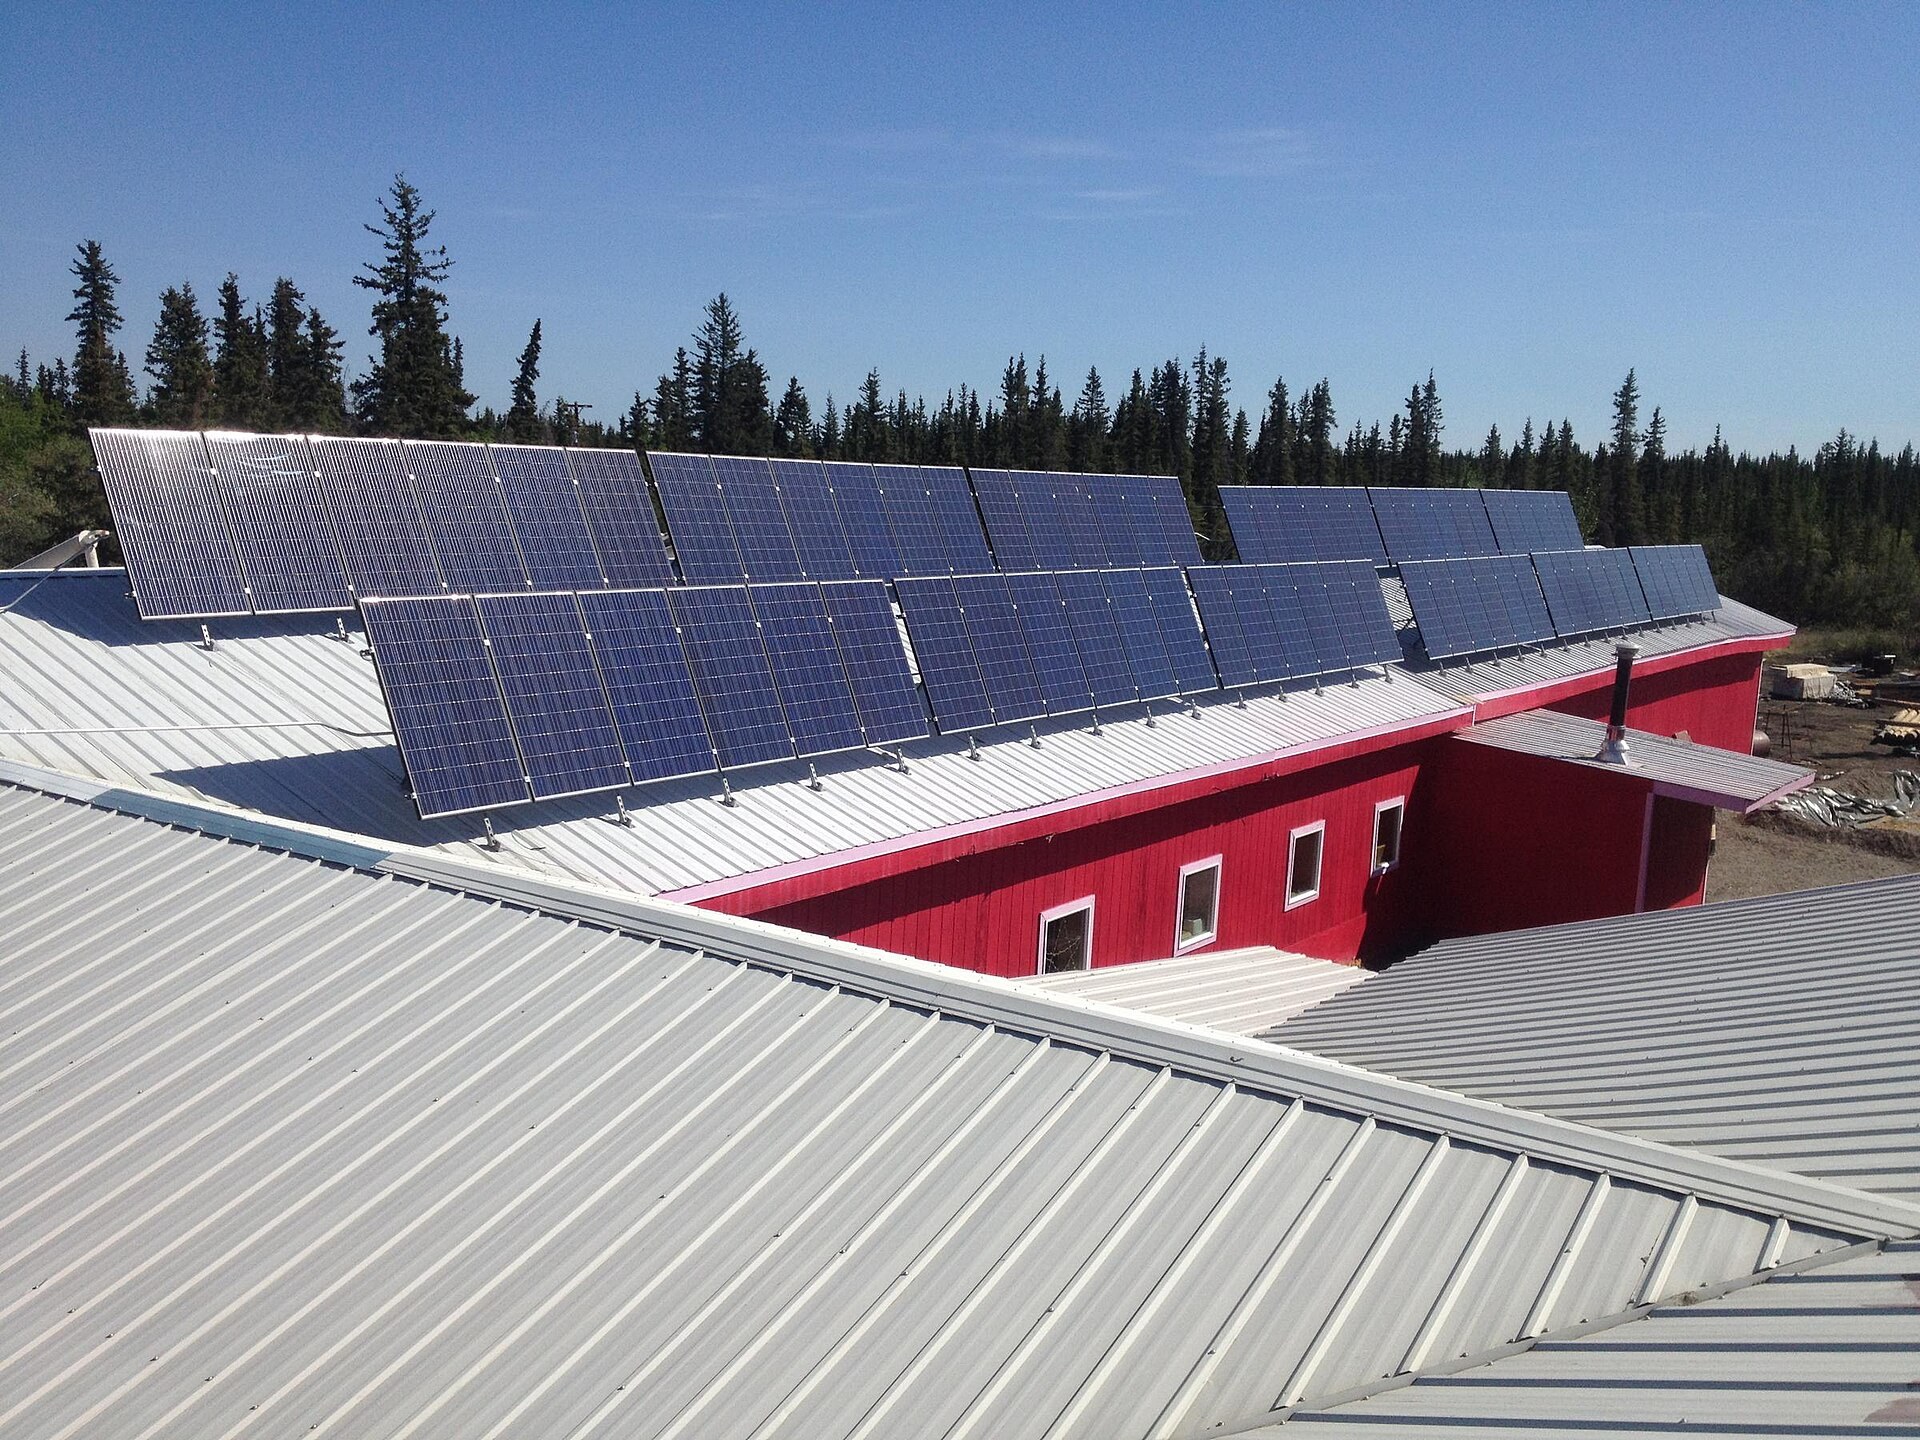
A 400-watt solar panel does not make 400 watts all day. It makes the equivalent of a handful of full-power hours, and how many of those hours a site gets decides how large an off-grid array has to be. The trade calls them peak sun hours: one peak sun hour is one kilowatt-hour of sunlight landing on a square meter of ground.
This atlas gives that number for all 50 US states, the District of Columbia and 43 European countries — the annual average everyone quotes, and the December figure that quietly decides the size of the array.
Key number
December was the darkest month at all 94 locations measured here. Their annual averages sit inside a 2.9-to-1 spread, from 5.85 kWh/m²/day at Phoenix down to 2.00 at Reykjavik. In December, on an array tilted for winter, Phoenix still holds 5.74 while Seattle falls to 1.64 and Tallinn to 0.47 — a 12-to-1 spread, with Reykjavik off the bottom of it entirely.
An array sized on the annual average never sees that gap coming.
In this dataset
What One Peak Sun Hour Is
Solar panels are rated under standard test conditions, which include 1,000 watts of light per square meter. A peak sun hour is one hour at that intensity: one kilowatt-hour of energy arriving on each square meter.
Real sunlight is weaker than that for most of the day and stronger for a short window around noon in summer, so the day’s total energy gets converted into the number of full-strength hours it would have taken to deliver the same amount.
That conversion is why the unit doubles as an energy figure. A site with 4.2 peak sun hours receives 4.2 kilowatt-hours of light energy per square meter per day.
Point a 400-watt panel at it and the panel’s theoretical harvest is 0.4 × 4.2, or 1.68 kilowatt-hours a day, before anything is lost to heat, wiring, the charge controller and the battery.
Peak sun hours are not sunshine hours. An overcast day logs no bright sunshine at a weather station and still delivers real diffuse energy to an array. This atlas counts energy, which is what a battery bank cares about.
Why December Sizes the Array
A grid-tied system runs an annual balance: summer surplus goes out to the utility, winter shortfall comes back in, and the annual average is a fair basis for sizing. An off-grid system has no such counterparty. Every kilowatt-hour used in December had to be made in December.
Batteries do not close that gap. A battery bank is sized in days of autonomy, typically two to four; a seasonal shortfall lasts eight to twelve weeks. Nothing in a normal bank stores July for January.
So the array is sized on the worst month of the year, the number designers call the design month, and the rest of the year runs in surplus by design.
In this dataset the worst month was December at every single location, from Honolulu at 21° north to Reykjavik at 64° north. That is not an assumption carried into the calculation; each site’s twelve monthly averages were compared and December came out lowest in all 94.
Tilt is the lever that partly reverses the loss. A flat panel meets December light at a punishing angle; standing the array up to roughly latitude plus 15 degrees turns it toward that low sun.
The gain is worth a median of 2.03× across all 94 locations, and it climbs with latitude: at the eighteen points above 50° north the median is 2.55×.
Here is the same 6 kWh-a-day load, sized three ways, with the 25% system losses the sizing calculator uses as its default:
| Site | Sized on annual average | Sized on December, panels flat | Sized on December, panels tilted for winter |
|---|---|---|---|
| Phoenix, Arizona | 1.37 kW | 2.62 kW | 1.39 kW |
| Denver, Colorado | 1.66 kW | 3.70 kW | 1.72 kW |
| Madrid, Spain | 1.64 kW | 3.88 kW | 1.79 kW |
| Seattle, Washington | 2.32 kW | 10.26 kW | 4.88 kW |
| Berlin, Germany | 2.62 kW | 14.55 kW | 6.25 kW |
Read the last column across and the real geography of off-grid solar appears. In Phoenix, Denver and Madrid a winter-tilted array sized for December is barely larger than one sized on the annual average, because a steep tilt hands back almost everything the season took. In Seattle and Berlin it is more than twice as large.
Take your state’s December figure from the table below, put it in the peak sun hours field of the off-grid solar sizing calculator, and read off the array size.
North of about 40° the answer is often large enough that a winter generator run becomes the cheaper fix, a trade-off laid out in whether an off-grid system still needs a generator.
Take your country’s December figure from the table below, put it in the peak sun hours field of the off-grid solar sizing calculator, and read off the array size.
North of the Alps the answer is often large enough that a winter generator or a wood-fired heat source carries part of the season, a trade-off laid out in whether an off-grid system still needs a generator.
Two things move the December number that no dataset can see. Snow on a panel produces nothing, which is a second argument for a steep tilt, since snow slides off it. And a treeline the summer sun clears easily throws shade straight across the array in December.
The Map
Both maps are colored by the same figure: December irradiation on a fixed, equator-facing array tilted to latitude plus 15 degrees, in kilowatt-hours per square meter per day. That is the design number. Use the buttons to switch continents.
under 0.750.75 – 1.251.25 – 2.002.00 – 3.003.00 – 4.004.00 – 5.005.00 and over
The annual averages draw a gentler map than this one. On an annual basis the continental US spans only 1.7 to 1, Arizona to Washington. In December, on a winter-tilted array, the same two states are 3.5 to 1 apart.
Europe is starker still: Cyprus and Estonia sit inside a 2-to-1 band on the annual average and nearly 10 to 1 in December.
Every US State and European Country
Rows start with the 51 US entries in alphabetical order, then the 43 European countries. Tap any column heading to re-sort, including across both continents at once. Every figure is a daily average in kilowatt-hours per square meter, which is the same thing as peak sun hours.
Annual and December, flat are horizontal-plane figures. Winter tilt is the fixed angle used: latitude plus 15 degrees, never more than 70. Tilt gain is the tilted December figure divided by the flat one. Annual ÷ December is the size of the seasonal hole.
| Location | Annual | December, flat | Winter tilt | December, tilted | Tilt gain | Annual ÷ December |
|---|---|---|---|---|---|---|
| Alabama Birmingham · US state | 4.62 | 2.28 | 49° | 3.97 | 1.74× | 2.0× |
| Alaska† Anchorage · US state | 2.57 | 0.16 | 70° | 0.57 | 3.60× | 16× |
| Arizona Phoenix · US state | 5.85 | 3.05 | 48° | 5.74 | 1.88× | 1.9× |
| Arkansas Little Rock · US state | 4.59 | 2.23 | 50° | 4.06 | 1.82× | 2.1× |
| California Los Angeles · US state | 5.38 | 2.76 | 49° | 5.11 | 1.85× | 1.9× |
| Colorado Denver · US state | 4.81 | 2.16 | 55° | 4.65 | 2.16× | 2.2× |
| Connecticut Bridgeport · US state | 4.05 | 1.50 | 56° | 2.98 | 1.99× | 2.7× |
| Delaware Wilmington · US state | 4.12 | 1.69 | 55° | 3.37 | 1.99× | 2.4× |
| District of Columbia Washington · US federal district | 4.18 | 1.81 | 54° | 3.56 | 1.97× | 2.3× |
| Florida Jacksonville · US state | 4.91 | 2.89 | 45° | 4.76 | 1.64× | 1.7× |
| Georgia Atlanta · US state | 4.71 | 2.32 | 49° | 4.09 | 1.76× | 2.0× |
| Hawaii Honolulu · US state | 5.66 | 3.95 | 36° | 5.53 | 1.40× | 1.4× |
| Idaho Boise · US state | 4.51 | 1.30 | 59° | 2.88 | 2.22× | 3.5× |
| Illinois Chicago · US state | 3.72 | 1.12 | 57° | 1.91 | 1.71× | 3.3× |
| Indiana Indianapolis · US state | 4.05 | 1.37 | 55° | 2.50 | 1.83× | 3.0× |
| Iowa Des Moines · US state | 4.11 | 1.49 | 57° | 3.12 | 2.10× | 2.8× |
| Kansas Wichita · US state | 4.65 | 2.05 | 53° | 4.02 | 1.96× | 2.3× |
| Kentucky Louisville · US state | 4.24 | 1.65 | 53° | 3.08 | 1.87× | 2.6× |
| Louisiana New Orleans · US state | 4.80 | 2.68 | 45° | 4.25 | 1.59× | 1.8× |
| Maine Portland · US state | 3.79 | 1.30 | 59° | 2.89 | 2.22× | 2.9× |
| Maryland Baltimore · US state | 4.15 | 1.76 | 54° | 3.51 | 1.99× | 2.4× |
| Massachusetts Boston · US state | 3.96 | 1.45 | 57° | 3.12 | 2.15× | 2.7× |
| Michigan Detroit · US state | 3.86 | 1.16 | 57° | 2.22 | 1.92× | 3.3× |
| Minnesota Minneapolis · US state | 3.84 | 1.18 | 60° | 2.71 | 2.30× | 3.3× |
| Mississippi Jackson · US state | 4.74 | 2.43 | 47° | 4.11 | 1.69× | 1.9× |
| Missouri Kansas City · US state | 4.31 | 1.84 | 54° | 3.73 | 2.03× | 2.4× |
| Montana Billings · US state | 4.03 | 1.12 | 61° | 2.72 | 2.43× | 3.6× |
| Nebraska Omaha · US state | 4.17 | 1.59 | 56° | 3.34 | 2.10× | 2.6× |
| Nevada Las Vegas · US state | 5.65 | 2.66 | 51° | 5.31 | 2.00× | 2.1× |
| New Hampshire Manchester · US state | 3.82 | 1.37 | 58° | 3.01 | 2.20× | 2.8× |
| New Jersey Newark · US state | 4.07 | 1.63 | 56° | 3.29 | 2.02× | 2.5× |
| New Mexico Albuquerque · US state | 5.64 | 2.83 | 50° | 5.50 | 1.94× | 2.0× |
| New York New York City · US state | 3.93 | 1.56 | 56° | 3.08 | 1.98× | 2.5× |
| North Carolina Charlotte · US state | 4.56 | 2.26 | 50° | 4.15 | 1.84× | 2.0× |
| North Dakota Fargo · US state | 3.65 | 0.99 | 62° | 2.52 | 2.54× | 3.7× |
| Ohio Columbus · US state | 3.99 | 1.34 | 55° | 2.45 | 1.83× | 3.0× |
| Oklahoma Oklahoma City · US state | 4.86 | 2.33 | 50° | 4.34 | 1.86× | 2.1× |
| Oregon Portland · US state | 3.54 | 0.92 | 61° | 1.89 | 2.05× | 3.9× |
| Pennsylvania Philadelphia · US state | 4.09 | 1.69 | 55° | 3.43 | 2.03× | 2.4× |
| Rhode Island Providence · US state | 3.97 | 1.50 | 57° | 3.19 | 2.12× | 2.6× |
| South Carolina Charleston · US state | 4.79 | 2.55 | 48° | 4.36 | 1.71× | 1.9× |
| South Dakota Sioux Falls · US state | 4.04 | 1.40 | 59° | 3.24 | 2.31× | 2.9× |
| Tennessee Nashville · US state | 4.31 | 1.86 | 51° | 3.31 | 1.78× | 2.3× |
| Texas Houston · US state | 4.81 | 2.60 | 45° | 4.10 | 1.58× | 1.9× |
| Utah Salt Lake City · US state | 4.65 | 1.60 | 56° | 3.20 | 2.00× | 2.9× |
| Vermont Burlington · US state | 3.62 | 1.04 | 59° | 2.16 | 2.08× | 3.5× |
| Virginia Virginia Beach · US state | 4.43 | 2.06 | 52° | 3.85 | 1.87× | 2.1× |
| Washington Seattle · US state | 3.45 | 0.78 | 63° | 1.64 | 2.10× | 4.4× |
| West Virginia Charleston · US state | 4.01 | 1.52 | 53° | 2.80 | 1.84× | 2.6× |
| Wisconsin Milwaukee · US state | 3.94 | 1.24 | 58° | 2.58 | 2.08× | 3.2× |
| Wyoming Cheyenne · US state | 4.59 | 1.86 | 56° | 4.12 | 2.21× | 2.5× |
| Albania Tirana · Europe | 4.35 | 1.72 | 56° | 3.56 | 2.07× | 2.5× |
| Andorra Andorra la Vella · Europe | 4.05 | 1.65 | 58° | 3.36 | 2.04× | 2.5× |
| Austria Vienna · Europe | 3.43 | 0.87 | 63° | 1.84 | 2.13× | 4.0× |
| Belarus Minsk · Europe | 2.90 | 0.40 | 69° | 0.90 | 2.25× | 7.2× |
| Belgium Brussels · Europe | 3.03 | 0.64 | 66° | 1.48 | 2.30× | 4.7× |
| Bosnia and Herzegovina Sarajevo · Europe | 3.61 | 1.26 | 59° | 2.46 | 1.95× | 2.9× |
| Bulgaria Sofia · Europe | 3.98 | 1.37 | 58° | 2.54 | 1.85× | 2.9× |
| Croatia Zagreb · Europe | 3.73 | 1.06 | 61° | 2.13 | 2.01× | 3.5× |
| Cyprus Nicosia · Europe | 5.31 | 2.57 | 50° | 4.60 | 1.79× | 2.1× |
| Czechia Prague · Europe | 3.20 | 0.73 | 65° | 1.60 | 2.20× | 4.4× |
| Denmark Copenhagen · Europe | 2.94 | 0.33 | 70° | 0.86 | 2.60× | 8.9× |
| Estonia Tallinn · Europe | 2.68 | 0.14 | 70° | 0.47 | 3.32× | 19× |
| Finland Helsinki · Europe | 2.69 | 0.13 | 70° | 0.52 | 4.16× | 22× |
| France Paris · Europe | 3.34 | 0.87 | 64° | 1.98 | 2.29× | 3.9× |
| Germany Berlin · Europe | 3.05 | 0.55 | 68° | 1.28 | 2.35× | 5.6× |
| Greece Athens · Europe | 4.93 | 2.07 | 53° | 3.78 | 1.83× | 2.4× |
| Hungary Budapest · Europe | 3.61 | 0.89 | 63° | 1.76 | 1.98× | 4.1× |
| Iceland† Reykjavik · Europe | 2.00 | 0.01 | 70° | 0.05 | 4.53× | 177× |
| Ireland Dublin · Europe | 2.76 | 0.58 | 68° | 1.60 | 2.79× | 4.8× |
| Italy Rome · Europe | 4.50 | 1.73 | 57° | 3.71 | 2.15× | 2.6× |
| Kosovo Pristina · Europe | 4.01 | 1.37 | 58° | 2.62 | 1.91× | 2.9× |
| Latvia Riga · Europe | 2.78 | 0.24 | 70° | 0.63 | 2.61× | 12× |
| Liechtenstein Vaduz · Europe | 3.18 | 0.96 | 62° | 2.05 | 2.15× | 3.3× |
| Lithuania Vilnius · Europe | 2.82 | 0.35 | 70° | 0.77 | 2.22× | 8.2× |
| Luxembourg Luxembourg City · Europe | 3.17 | 0.68 | 65° | 1.41 | 2.06× | 4.6× |
| Malta Valletta · Europe | 5.07 | 2.30 | 51° | 4.00 | 1.74× | 2.2× |
| Moldova Chisinau · Europe | 3.65 | 0.87 | 62° | 1.69 | 1.94× | 4.2× |
| Monaco Monaco · Europe | 4.37 | 1.56 | 59° | 3.57 | 2.29× | 2.8× |
| Montenegro Podgorica · Europe | 4.27 | 1.53 | 57° | 3.28 | 2.14× | 2.8× |
| Netherlands Amsterdam · Europe | 2.96 | 0.54 | 67° | 1.26 | 2.32× | 5.5× |
| North Macedonia Skopje · Europe | 4.14 | 1.46 | 57° | 2.76 | 1.90× | 2.8× |
| Norway Oslo · Europe | 2.60 | 0.15 | 70° | 0.55 | 3.63× | 17× |
| Poland Warsaw · Europe | 3.05 | 0.52 | 67° | 1.13 | 2.19× | 5.9× |
| Portugal Lisbon · Europe | 4.81 | 2.04 | 54° | 3.91 | 1.92× | 2.4× |
| Romania Bucharest · Europe | 3.92 | 1.17 | 59° | 2.29 | 1.97× | 3.4× |
| Serbia Belgrade · Europe | 3.80 | 1.11 | 60° | 2.17 | 1.96× | 3.4× |
| Slovakia Bratislava · Europe | 3.55 | 0.82 | 63° | 1.68 | 2.06× | 4.3× |
| Slovenia Ljubljana · Europe | 3.54 | 0.96 | 61° | 1.80 | 1.88× | 3.7× |
| Spain Madrid · Europe | 4.87 | 2.06 | 55° | 4.48 | 2.18× | 2.4× |
| Sweden Stockholm · Europe | 2.71 | 0.17 | 70° | 0.63 | 3.73× | 16× |
| Switzerland Bern · Europe | 3.59 | 1.01 | 62° | 2.07 | 2.05× | 3.6× |
| Ukraine Kyiv · Europe | 3.27 | 0.59 | 65° | 1.16 | 1.95× | 5.5× |
| United Kingdom London · Europe | 2.93 | 0.67 | 67° | 1.67 | 2.50× | 4.4× |
† Alaska sits outside the coverage of the US satellite radiation product used for the other 50 rows and is computed from the reanalysis series instead.
Iceland’s December value is at the floor of what any satellite product can resolve at 64° north; both sources used here put Reykjavik below 0.05 kWh/m²/day in December, which is another way of saying that solar is not a December energy source there.
Download the full table as CSV →
The CSV adds the latitude and longitude of each reference point, the annual average on the tilted plane, and the two cross-check values described below.
How These Numbers Were Made
Each row is one point rather than a whole state or country. US rows use the largest city in the state, European rows use the capital, and that choice is named in the table and the CSV because it matters.
A large state holds more than one solar climate. Spokane, at the far side of Washington from Seattle, runs about 10% higher on the annual average and about 12% lower in December on the same winter tilt.
Monthly irradiation came from the Photovoltaic Geographical Information System run by the European Commission’s Joint Research Center. European rows use PVGIS 5.3, released in September 2024, on the CM SAF SARAH-3 satellite database covering 2005 to 2023.
US rows use the NREL National Solar Radiation Database series served by PVGIS 5.2, covering 2005 to 2015, which is the satellite product built for North America. Alaska falls outside that product’s coverage above 60° north and uses the ERA5 reanalysis series for 2005 to 2023 instead.
For every point the horizontal and tilted monthly totals were averaged across all available years, divided by the length of each month to give a daily figure, and the lowest of the twelve months taken as the worst. The tilted plane is fixed and equator-facing at latitude plus 15 degrees, rounded to the nearest degree and capped at 70, with no tracking.
PVGIS includes terrain shadowing from its elevation model; local shading from trees and buildings is beyond any dataset.
All 94 points were then pulled a second time from an independent source: the NASA POWER monthly climatology, a 20-year average covering January 2001 to December 2020, built on CERES SYN1deg satellite data by NASA Langley Research Center.
On annual horizontal irradiation the median difference between the two is 1.9%, and 93 of 94 points agree within 10%. Both values sit in the CSV, so the check is repeatable.
These figures carry no system losses. They are sunlight arriving at a surface; inverter, wiring, temperature and battery losses belong in the sizing step that follows. Nor do they model a specific roof, which has its own azimuth, pitch and horizon.
Verified September 2026. PVGIS series retrieved 2 September 2026 from PVGIS 5.3 and 5.2; NASA POWER climatology retrieved the same day from the POWER monthly climatology endpoint. Both products are updated on their own schedules; the retrieval date is the date to quote.
Common Questions
Should I size my array on the annual average or on December?
On December, if the system has to carry the house through winter without help. Sizing on the annual average leaves a shortfall that runs for weeks, and no normal battery bank bridges a season. The one time the annual average is the right basis is a summer-only cabin or a system that has a generator scheduled to cover the dark months anyway.
Why is my state’s number different from the one I have seen elsewhere?
Three reasons, usually. Charts differ by satellite vintage: the series behind the US rows here covers 2005 to 2015, the European one 2005 to 2023.
Some quote a tilted or a tracking figure without saying which. And a state is not a point — Spokane and Seattle are both Washington, and their December figures on the same winter tilt are 1.44 and 1.64 kWh/m²/day.
Does a steeper tilt cost me anything in summer?
Yes, and it usually does not matter. A latitude-plus-15 array gives up a slice of the June and July harvest, which is the part of the year an off-grid system is already throwing away because the battery is full by early afternoon. The trade is summer surplus you cannot use for December energy you badly need.
Are these figures usable outside the named city?
Treat them as a regional starting point, then check your own coordinates. The free PVGIS tool covers Europe and the Americas point by point, and NREL’s PVWatts does the same for US addresses. Either gives a site-specific monthly table in minutes; the December row is the one to carry forward.
Sources: Photovoltaic Geographical Information System 5.3 (CM SAF SARAH-3, 2005–2023) and 5.2 (NREL National Solar Radiation Database, 2005–2015; ERA5, 2005–2023), Joint Research Center, European Commission. NASA POWER monthly climatology, January 2001 to December 2020 (CERES SYN1deg), NASA Langley Research Center. Standard test conditions reference irradiance of 1,000 W/m², Sandia National Laboratories PV Performance Modeling Collaborative.