


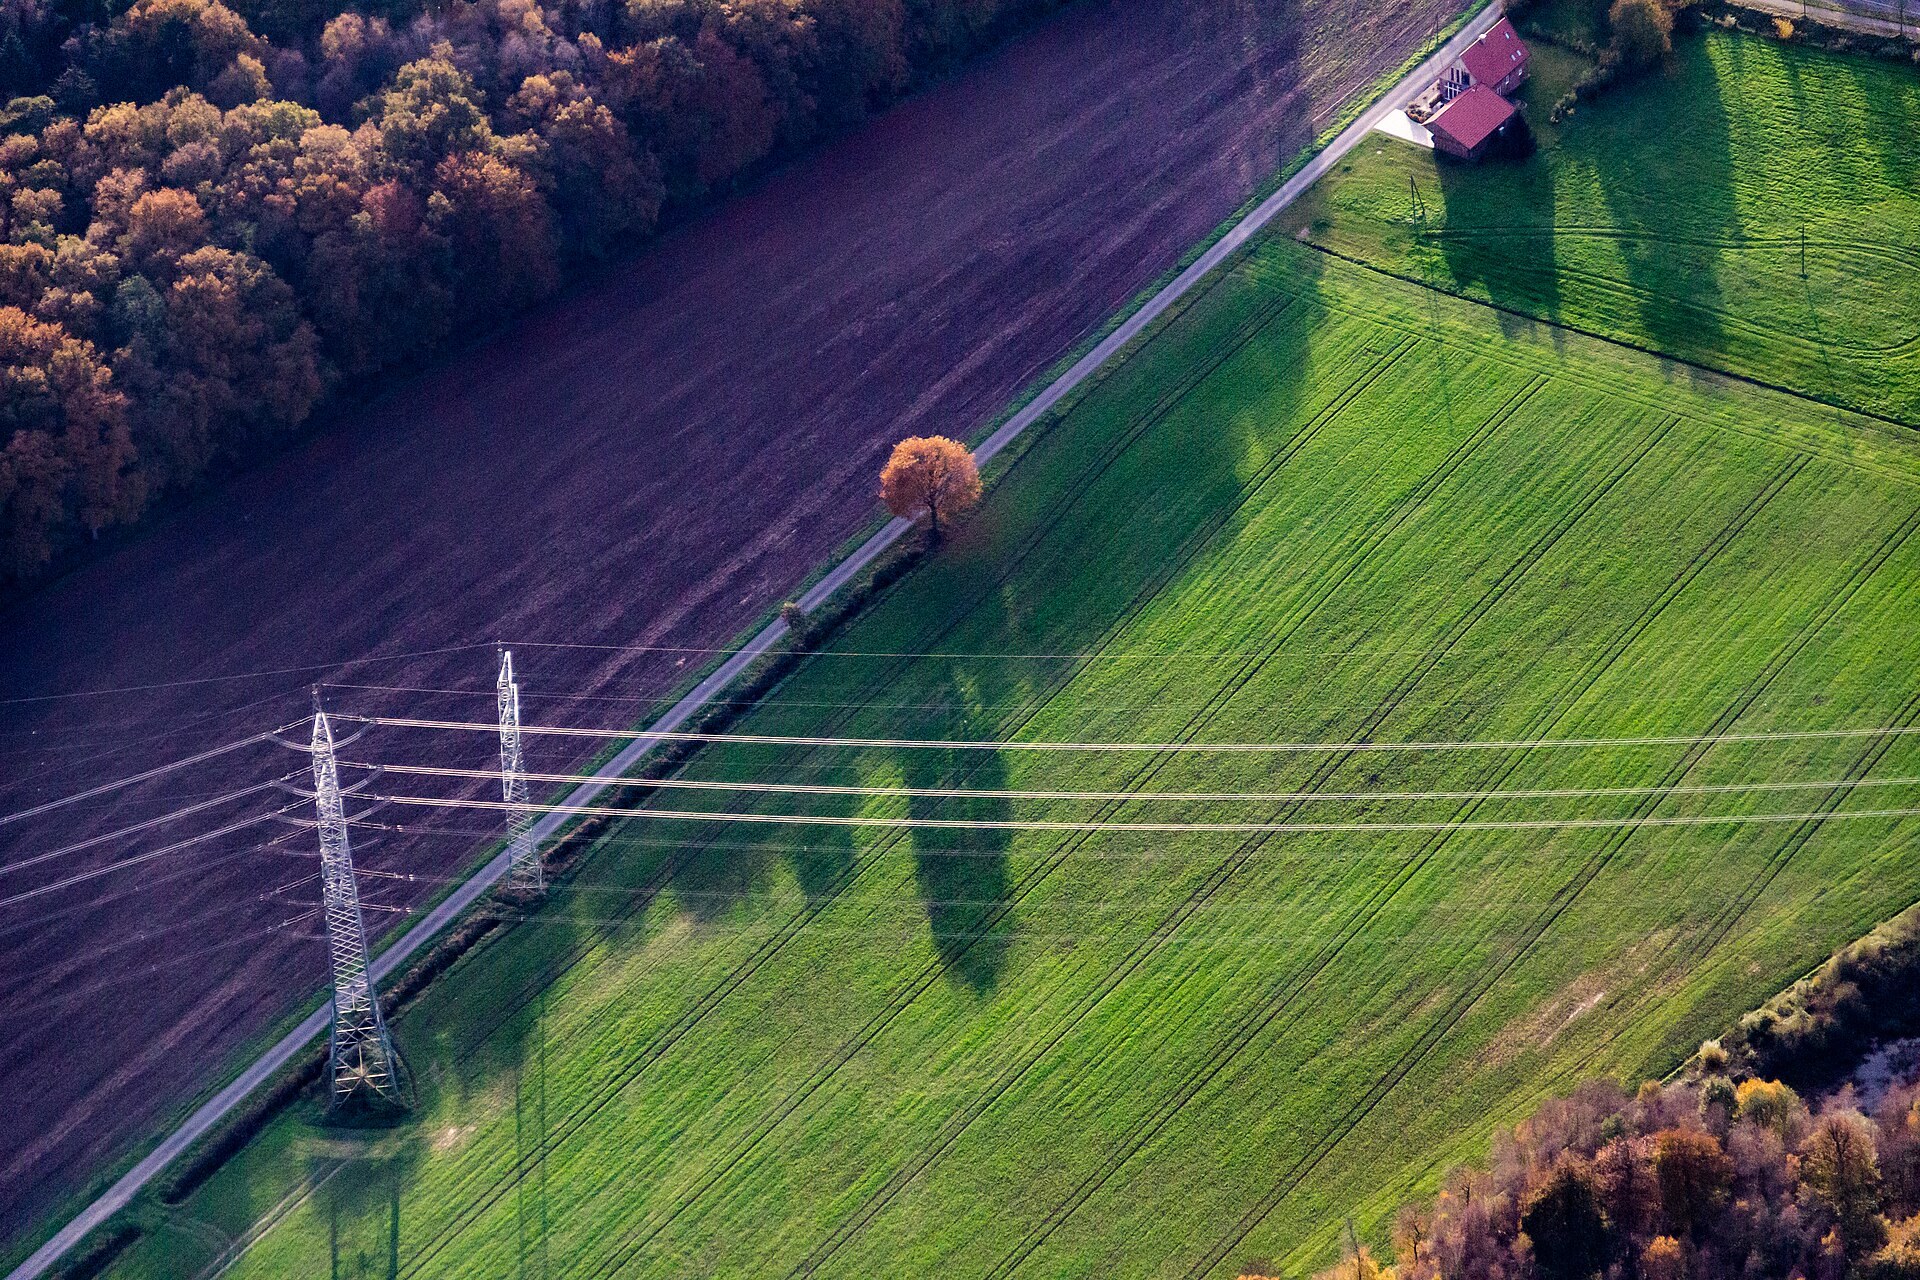
A European household loses power for somewhere between a quarter of an hour and sixty-odd hours a year, depending almost entirely on which side of a border it sits. That spread is not a rumor and it is not a feeling — national regulators measure it, publish it, and hand it to one body that puts every country in the same table. Germany sits at one end of that table, Kosovo at the other, and the rest of Europe is strung out between them.
Two numbers carry the whole thing. SAIDI counts the minutes the average customer spends off supply in a year. SAIFI counts how many separate times the lights go out to produce those minutes. Divide the first by the second and you get the number the report does not print but a household actually needs: how long one interruption tends to last where you live.
Key number
Across the 33 countries in the table below, the average customer lost between 16 and 3,940 minutes of supply to unplanned interruptions in 2018 — a spread of more than two hundred to one. Germany sat at 16 minutes a year across 0.27 interruptions. Romania sat at 463 minutes across 4.32. Same continent, same year, same counting exercise.
Minutes Off Supply, Country by Country
Everything below comes from the 7th CEER-ECRB Benchmarking Report on the Quality of Electricity and Gas Supply, published by the Council of European Energy Regulators on 22 December 2022, using each national regulator's own returns for 2018 — the most recent year the report carries. Rows start in resilience-score order, explained further down. Tap a column heading to re-sort.
| # | Country | Minutes off per year | Interruptions per year | Typical length (min) | Resilience score |
|---|---|---|---|---|---|
| 1 | Germany | 16 | 0.27 | 61 | 91 |
| 2 | Switzerland | 18 | 0.30 | 60 | 89 |
| 3 | Denmark | 17 | 0.44 | 39 | 85 |
| 4 | Luxembourg | 24 | 0.35 | 68 | 84 |
| 5 | Cyprus | 39 | 0.25 | 156 | 83 |
| 6 | Netherlands | 27 | 0.41 | 67 | 81 |
| 7 | Belgium | 26 | 0.63 | 42 | 77 |
| 8 | Austria | 31 | 0.66 | 48 | 75 |
| 9 | France† | 51 | 0.69 | 74 | 69 |
| 10 | Finland | 49 | 1.52 | 32 | 61 |
| 11 | Spain | 59 | 1.26 | 47 | 61 |
| 12 | Hungary | 79 | 0.99 | 80 | 60 |
| 13 | Lithuania | 82 | 1.10 | 74 | 59 |
| 14 | Malta | 69 | 1.87 | 37 | 55 |
| 15 | Slovenia | 78 | 1.74 | 45 | 54 |
| 16 | Estonia | 130 | 1.37 | 95 | 51 |
| 17 | Sweden | 126 | 1.49 | 85 | 51 |
| 18 | Czechia | 115 | 1.79 | 64 | 50 |
| 19 | Latvia | 105 | 1.93 | 54 | 50 |
| 20 | Italy | 101 | 2.14 | 47 | 49 |
| 21 | Norway | 126 | 1.97 | 64 | 48 |
| 22 | Ireland | 212 | 1.71 | 124 | 44 |
| 23 | Poland | 143 | 2.58 | 55 | 43 |
| 24 | Portugal | 201 | 1.90 | 106 | 43 |
| 25 | Greece | 173 | 2.33 | 74 | 42 |
| 26 | Croatia | 188 | 2.33 | 81 | 41 |
| 27 | Bosnia and Herzegovina† | 294 | 4.96 | 59 | 28 |
| 28 | Romania | 463 | 4.32 | 107 | 25 |
| 29 | Moldova | 505 | 5.40 | 94 | 22 |
| 30 | Serbia | 441 | 6.00 | 74 | 22 |
| 31 | Ukraine | 1054 | 8.25 | 128 | 10 |
| 32 | Kosovo† | 3940 | 55.31 | 71 | 0 |
| 33 | Montenegro | 1912 | 28.88 | 66 | 0 |
Minutes and interruption counts are unplanned interruptions, all events included. † France, Bosnia and Herzegovina and Kosovo report only the excluding-exceptional-events series, so their figures sit on that basis and read slightly low against the rest. Great Britain is measured in the same report but is left out of this ranking. Planned interruptions, which the regulator schedules and warns you about, are counted separately and are not in this table.
The order will surprise anyone who assumes wealth decides it. Cyprus, an island with no interconnector to lean on, finishes fifth — because its grid almost never fails, only 0.25 times a year per customer, even though each failure runs long. Sweden and Norway finish mid-table, well behind Hungary and Lithuania, because forest, snow load and long rural feeders cost more minutes than money can quickly buy back.
Where the Minutes Pile Up
One square per country, sized the same so a small country is as readable as a large one, shaded by minutes off supply. Position is approximate rather than cartographic; the point is the pattern, and the pattern is a gradient running from the North Sea coast toward the southeast.
The dark green block — Germany, Denmark, the Netherlands, Switzerland, Luxembourg, Belgium — is short distances, heavily meshed networks and a high share of buried distribution cable. Move outward and overhead line takes over, spans get longer, and the minutes climb with them. The Balkan and eastern edge of the map is a different order of magnitude, and Montenegro, Kosovo and Ukraine sit far past the top band.
Rare and Long, or Frequent and Short
Two countries can lose similar minutes a year in completely different shapes, and the shape decides what you buy. Minutes that arrive as one long winter outage are a job for stored energy. The same minutes arriving as a scatter of short drops are a job for something that switches over fast enough that the freezer and the router never notice.
Each dot is one country, 2018. Horizontal: how often supply fails. Vertical: how long one failure runs on average, from minutes divided by count. Ukraine, Montenegro and Kosovo fall outside the plotted range.
Cyprus sits alone in the top left: a quarter of an interruption a year, but roughly two and a half hours when it happens. Finland and Malta sit low and right — more frequent, and done inside forty minutes. Ireland and Portugal are up in the long-outage half with ordinary interruption counts, which is the profile that empties a fridge.
Work out which half you are in, then size the hardware against that shape rather than against the headline minutes. The backup power calculator takes the loads you actually want to hold up and the hours you want to hold them, so a two-hour Cypriot outage and a thirty-minute Finnish one produce very different answers from the same house.
How the Resilience Score Is Built
The score is arithmetic rather than judgment, and it is worth being able to redo on the back of an envelope. It is out of 100, half for duration and half for frequency, both on a decade scale because the raw numbers span two orders of magnitude.
| Half | Formula | Anchors |
|---|---|---|
| Duration, 50 points | 50 × (1 − (log₁₀(SAIDI) − 1) ÷ 2) | 10 min = 50 pts, 100 min = 25 pts, 1,000 min = 0 pts |
| Frequency, 50 points | 50 × (1 − (log₁₀(SAIFI) + 0.7) ÷ 2) | 0.2 = 50 pts, 2.0 = 25 pts, 20 = 0 pts |
| Total | duration + frequency, each clamped to 0–50 | 0 to 100 |
Worked example, Spain. SAIDI is 59.40 minutes, so log₁₀ is 1.774, the bracket is 0.387, and the duration half pays 30.7 points. SAIFI is 1.26, so log₁₀ is 0.100, the bracket is 0.400, and the frequency half pays 30.0. Total 60.7, rounded to 61. Every row in the table and in the CSV is that same pair of lines.
What the score deliberately does not do is weight one country's storms against another's. A high score means a grid that rarely fails and recovers fast in a normal year. It says nothing about the once-in-a-decade event, which is the next section.
The Big Blackouts
Annual averages hide the events that make people buy a battery. Below are the European outages that reached national scale, each with what the official investigation concluded rather than what was said in the first week.
| Date | Where | Scale | Time to restore | Cause, per the official finding |
|---|---|---|---|---|
| 26–28 Dec 1999 | France | 3.4 million customers | Days for most; worst-hit rural feeders far longer | Storms Lothar and Martin damaged around 540 high-voltage and very-high-voltage lines and more than a thousand pylons, about 8% of the transmission network |
| 23 Sep 2003 | Sweden and Denmark | About 5 million people | Hours | Loss of 1,175 MW at Oskarshamn 3, then a double busbar failure at a high-voltage substation split the Nordic grid |
| 28 Sep 2003 | Italy and parts of Switzerland | More than 56 million people | About 3 hours in the north; rolling cuts still hitting some areas on 29–30 September | A 400 kV line flashed over to a tree in Switzerland; reroutes overloaded and Italy separated from the continent (UCTE final report, April 2004) |
| 8–9 Jan 2005 | Sweden | 415,000 homes | About 10,000 homes still dark after three weeks | Cyclone Gudrun flattened forest across the south onto distribution lines |
| 4 Nov 2006 | Continental Europe | More than 15 million households in Germany, France, Italy, Belgium, Spain and Portugal | Resynchronized 38 minutes after the split, normal conditions everywhere inside two hours | A 380 kV line over the Ems was switched off for a ship, then an uncoordinated busbar coupling meant to relieve the resulting overload made it worse; the synchronous area split into three parts inside twenty seconds (UCTE final report, 30 January 2007) |
| 11 Jul 2011 | Cyprus | Vasilikos station, 47% of the utility's installed capacity | Rolling cuts of two to three hours per area while capacity was replaced | A munitions store detonated at the Evangelos Florakis naval base next door and wrecked the plant |
| 31 Mar 2015 | Turkey | All 81 provinces, effectively the whole country | About 8 hours: east and west resynchronized at 16:12, about 95% of load back by 18:30 | Spring maintenance had lines and capacitor banks out; the Osmanca–Kurşunlu trip collapsed the east-west corridor (ENTSO-E report, 21 September 2015) |
| 23 Dec 2015 | Western Ukraine | About 230,000 customers | 1 to 6 hours | Coordinated intrusion into three distribution companies opened breakers remotely, the first confirmed cyberattack to black out a grid (E-ISAC and SANS analysis, 18 March 2016) |
| 9 Aug 2019 | Great Britain | 1.1 million customers | About 45 minutes | Lightning on a 400 kV line, then near-simultaneous loss of 737 MW at Hornsea and 641 MW at Little Barford (National Grid ESO technical report, 6 September 2019) |
| 26 Nov 2021 | Great Britain | About 205,000 homes | Last customers restored 7 December | Storm Arwen; the regulator judged network operators' response unacceptable and £44 million was paid out (Ofgem review, 9 June 2022) |
| 28 Apr 2025 | Spain and Portugal | 31 GW of demand lost at 12:33 CEST, about 55 million people | Portugal fully restored 00:22 CEST, Spain 04:00 CEST on 29 April | Interacting factors: voltage and reactive power control gaps, oscillations, rapid output reductions and generator disconnections in Spain (ENTSO-E and ACER expert panel final report, 20 March 2026) |
Read the restore column rather than the customer column. Continental cascades are enormous and short, because a meshed transmission system is designed to be put back together in hours. Storms are smaller and far longer, because every broken pole has to be found and climbed. Gudrun and Arwen each left households cold for a week or more; the 2006 cascade reached six countries and was cleared inside two hours.
The blackout that makes the news is rarely the one that empties your freezer. A rural feeder down for five days never reaches a continental headline, and it is the one you would have to live through.
Method, Sources and Refresh
Country figures are the 2018 columns of Tables A2 and A9 of the 7th CEER-ECRB Benchmarking Report on the Quality of Electricity and Gas Supply, published 22 December 2022 — unplanned interruptions, all events, across 39 participating countries. Where a country reported no all-events series, Tables A3 and A10 are used instead and the row is marked. Typical interruption length is SAIDI divided by SAIFI. The resilience score uses only those two published figures and the formulas above.
Two cautions belong on the record. First, definitions of an “exceptional event” are set nationally and are not harmonized, so the storm years that matter most to a household are the years counted least consistently. Second, Georgia's 2018 return implies interruptions averaging under two minutes each, which does not describe an outage a household would notice, so that row is left out rather than blended in.
Where a regulator publishes a newer national figure than 2018, treat it as better evidence for that one country and this table as the comparison across countries, since only the benchmarking report puts every regulator on the same definitions in the same year.
Verified September 2026 against the published CEER report and the named incident reports. The full table, including the two point scores behind every country, is available as data.csv. This page is rebuilt each year when a new benchmarking report or a new incident report lands; the country figures move only when CEER publishes a new edition.
Common questions
Why is the data from 2018 when the report came out in 2022?
Regulators validate a full year of network returns before submitting them, and the benchmarking exercise then reconciles definitions across 39 countries. A three to four year lag between the measured year and the published comparison is normal for this dataset, and it is the price of every country being counted the same way.
Does a good score mean I do not need backup power?
It means an ordinary year is quiet. Germany's 16 minutes is an average that includes the households that lost nothing at all, and the score says nothing about the once-a-decade storm or cascade. Size against the outage you would find intolerable rather than the one an average year hands you.
Why is the United Kingdom missing from the ranking?
Great Britain is in the same report — 42.87 unplanned minutes across 0.51 interruptions in 2018, which on the same arithmetic would put it just behind Austria. The country table on this site leaves it out; it still appears in the blackout timeline above.
What is the difference between planned and unplanned minutes?
Planned interruptions are scheduled maintenance the network operator warns you about in advance, and they are reported separately. Every figure on this page is unplanned. In some countries planned minutes are larger than unplanned ones, which matters far less to a household because the date is known.
Sources: 7th CEER-ECRB Benchmarking Report on the Quality of Electricity and Gas Supply, Council of European Energy Regulators, 22 December 2022 (Tables A2, A3, A9, A10); UCTE Final Report on the System Disturbance of 4 November 2006, 30 January 2007; UCTE final report on the Italian blackout of 28 September 2003, April 2004; ENTSO-E Report on Blackout in Turkey on 31 March 2015, 21 September 2015; E-ISAC and SANS, Analysis of the Cyber Attack on the Ukrainian Power Grid, 18 March 2016; National Grid ESO Technical Report on the events of 9 August 2019, 6 September 2019; Ofgem review of network operator response to Storm Arwen, 9 June 2022; ENTSO-E and ACER Expert Panel final report on the Iberian Peninsula blackout of 28 April 2025, 20 March 2026.