


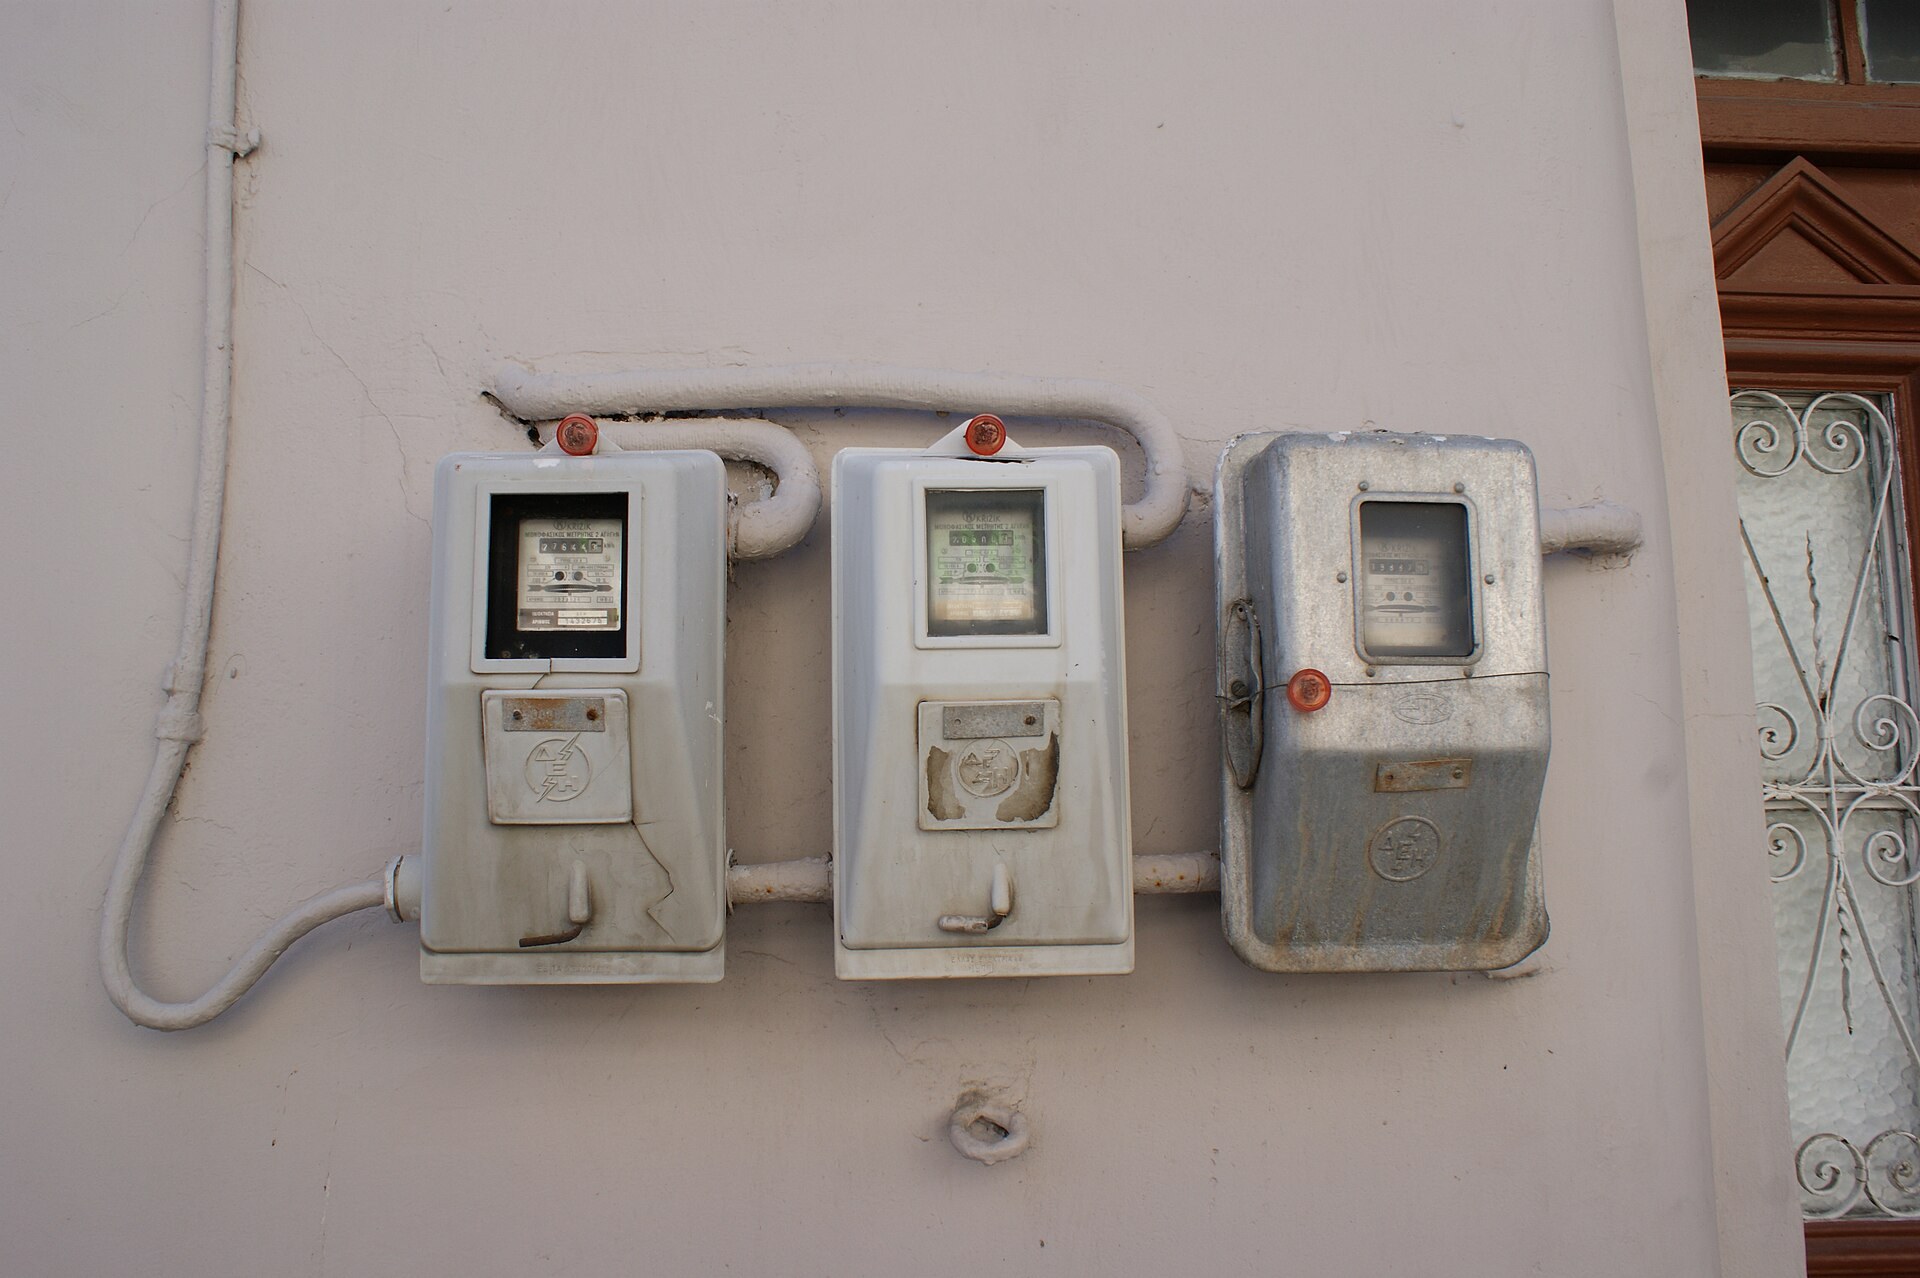
A kilowatt-hour is the same object everywhere. It boils the same kettle, turns the same freezer compressor, moves the same electric car the same distance. What changes between one place and the next is only what you are charged for handing it over — and that number swings fourfold inside the United States and more than sixfold across Europe. Every state and every country sit on one scale below, next to the question the price tables leave out: at these prices, is storing a kilowatt-hour cheaper than buying one?
Key number
In June 2026 a US household paid 13.11 cents per kilowatt-hour in Nevada and 52.72 cents in Hawaii — a 4.0x spread inside one country. In the second half of 2025 a household in the medium consumption band paid €0.1082 in Hungary and €0.4042 in Ireland — the two ends of the European Union, a 3.7x spread — and as little as €0.0636 in Türkiye at the far edge of the same collection. The US average was 18.34 cents; the European Union average was €0.2896.
What One Kilowatt-Hour Actually Buys
Before the prices, the physics. A kilowatt-hour is a thousand watts drawn for one hour, and it is defined as 3,412 British thermal units of heat. Every appliance claim on this page follows from that one line, which is why the quantity is worth learning once.
Run through a resistance heater, a kilowatt-hour releases all 3,412 BTU into the room and no more. Run through a heat pump working at a coefficient of performance of 3, it moves about three times that much heat indoors, because the machine carries warmth rather than making it. Which is why one price lands so differently on two houses in the same street.
In water, a kilowatt-hour will take about two and a half gallons from cold tap temperature to boiling if nothing is wasted. A real kettle loses some to the pot and the air, so call it two gallons. A 9-watt LED bulb burns a kilowatt-hour in 111 hours, which is four and a half days of continuous light.
In water, a kilowatt-hour will take about ten liters from cold tap temperature to boiling if nothing is wasted. A real kettle loses some to the pot and the air, so call it eight liters. A 9-watt LED bulb burns a kilowatt-hour in 111 hours, which is four and a half days of continuous light.
Two labels in your house are already written in these units. A refrigerator’s energy label declares kilowatt-hours per year; divide by 365 and you have its daily appetite. An electric car’s window label declares the energy it uses over a fixed distance; divide that distance by the label figure and you have how far one kilowatt-hour moves it.
Scale matters as much as the unit. The Energy Information Administration puts the average US home at about 10,500 kilowatt-hours a year, roughly 29 a day; air conditioning took 19 percent of residential electricity in the 2020 Residential Energy Consumption Survey. Eurostat’s reference band for a medium European household runs from 2,500 to 4,999 a year. The American house buys a much larger quantity, and the quantity turns out to matter more than the price.
If you want the draw of an individual machine rather than the annual total, the appliance wattage chart lists them, and the backup power calculator turns a list of them into the kilowatt-hours a battery or generator has to supply during an outage.
Every State and Every Country, Ranked
Both tables sort on any column heading. The US figures are the residential sector average for June 2026 from Table 5.6.A of the Electric Power Monthly, released on 26 August 2026, with the same month a year earlier beside them. The European figures are Eurostat’s band DC household prices for the second half of 2025, all taxes and levies included, the most recent half-year published.
Two derived columns do the work raw prices cannot. For the states, the typical home column is the 2024 average annual use per residential customer, and the final column multiplies it by today’s price. For the countries, the last column prices a flat 3,500 kilowatt-hours, a point inside band DC.
| # | State | Cents / kWh June 2026 | Year earlier | Change | Typical home kWh a year, 2024 | A year of that at the June 2026 price |
|---|---|---|---|---|---|---|
| 1 | Hawaii | 52.72 | 40.96 | +28.7% | 5,938 | $3,131 |
| 2 | California | 34.74 | 33.59 | +3.4% | 6,039 | $2,098 |
| 3 | Massachusetts | 29.61 | 30.33 | -2.4% | 6,836 | $2,024 |
| 4 | Maine | 29.59 | 28.14 | +5.2% | 6,601 | $1,953 |
| 5 | New York | 29.49 | 26.55 | +11.1% | 6,854 | $2,021 |
| 6 | Rhode Island | 29.23 | 26.84 | +8.9% | 6,802 | $1,988 |
| 7 | Alaska | 28.21 | 26.87 | +5.0% | 6,939 | $1,958 |
| 8 | New Hampshire | 27.01 | 23.51 | +14.9% | 7,428 | $2,006 |
| 9 | New Jersey | 24.95 | 24.88 | +0.3% | 7,949 | $1,983 |
| 10 | Vermont | 24.44 | 23.00 | +6.3% | 6,884 | $1,682 |
| 11 | District of Columbia | 24.39 | 22.70 | +7.4% | 7,672 | $1,871 |
| 12 | Connecticut | 24.32 | 27.19 | -10.6% | 8,335 | $2,027 |
| 13 | Michigan | 22.99 | 20.82 | +10.4% | 7,419 | $1,706 |
| 14 | Maryland | 21.84 | 19.29 | +13.2% | 11,146 | $2,434 |
| 15 | Pennsylvania | 21.73 | 19.69 | +10.4% | 9,806 | $2,131 |
| 16 | Illinois | 19.89 | 18.29 | +8.7% | 8,317 | $1,654 |
| 17 | Wisconsin | 19.56 | 18.52 | +5.6% | 7,742 | $1,514 |
| 18 | Delaware | 19.29 | 18.16 | +6.2% | 10,928 | $2,108 |
| 19 | Ohio | 19.19 | 17.50 | +9.7% | 10,146 | $1,947 |
| 20 | Minnesota | 17.52 | 17.12 | +2.3% | 8,548 | $1,498 |
| 21 | Indiana | 17.51 | 16.48 | +6.3% | 10,814 | $1,893 |
| 22 | Virginia | 17.22 | 15.23 | +13.1% | 12,388 | $2,133 |
| 23 | Colorado | 17.13 | 16.04 | +6.8% | 8,091 | $1,386 |
| 24 | Alabama | 16.40 | 16.06 | +2.1% | 13,718 | $2,250 |
| 25 | Georgia | 16.36 | 15.96 | +2.5% | 12,888 | $2,109 |
| 26 | Oregon | 16.32 | 15.80 | +3.3% | 10,582 | $1,727 |
| 27 | Missouri | 16.22 | 15.91 | +1.9% | 12,007 | $1,948 |
| 28 | Texas | 15.94 | 15.26 | +4.5% | 13,154 | $2,097 |
| 29 | Iowa | 15.93 | 15.33 | +3.9% | 9,987 | $1,591 |
| 30 | Kansas | 15.71 | 15.04 | +4.5% | 10,508 | $1,651 |
| 31 | South Carolina | 15.55 | 14.79 | +5.1% | 12,605 | $1,960 |
| 32 | West Virginia | 15.45 | 15.82 | -2.3% | 12,320 | $1,903 |
| 33 | South Dakota | 15.36 | 14.22 | +8.0% | 11,925 | $1,832 |
| 34 | Wyoming | 15.24 | 14.89 | +2.4% | 10,361 | $1,579 |
| 35 | Arizona | 15.18 | 15.23 | -0.3% | 12,899 | $1,958 |
| 36 | Montana | 15.14 | 14.81 | +2.2% | 10,226 | $1,548 |
| 37 | Florida | 15.10 | 15.35 | -1.6% | 13,250 | $2,001 |
| 38 | New Mexico | 15.06 | 14.68 | +2.6% | 7,849 | $1,182 |
| 39 | Washington | 14.91 | 12.96 | +15.0% | 11,465 | $1,709 |
| 40 | Mississippi | 14.88 | 14.07 | +5.8% | 13,871 | $2,064 |
| 41 | North Carolina | 14.74 | 13.38 | +10.2% | 12,184 | $1,796 |
| 42 | Idaho | 14.37 | 12.07 | +19.1% | 11,326 | $1,627 |
| 43 | Oklahoma | 14.33 | 13.63 | +5.1% | 12,949 | $1,856 |
| 44 | Kentucky | 14.26 | 13.40 | +6.4% | 12,558 | $1,791 |
| 45 | North Dakota | 14.12 | 13.71 | +3.0% | 12,344 | $1,743 |
| 46 | Arkansas | 14.12 | 13.37 | +5.6% | 12,580 | $1,776 |
| 47 | Tennessee | 14.07 | 13.82 | +1.8% | 13,843 | $1,948 |
| 48 | Louisiana | 13.49 | 12.74 | +5.9% | 14,422 | $1,946 |
| 49 | Utah | 13.37 | 13.10 | +2.1% | 9,290 | $1,242 |
| 50 | Nebraska | 13.25 | 13.14 | +0.8% | 11,477 | $1,521 |
| 51 | Nevada | 13.11 | 12.26 | +6.9% | 11,154 | $1,462 |
Residential sector, cents per kilowatt-hour. Source: Energy Information Administration, Electric Power Monthly, Table 5.6.A, June 2026; consumption from Electric Sales, Revenue, and Average Price, Table 5A, 2024.
| # | Country | € / kWh 2nd half of 2025 | Euro cents | Same price in purchasing power standards | 3,500 kWh a year costs |
|---|---|---|---|---|---|
| 1 | Ireland | 0.4042 | 40.4 | 0.3415 | €1,415 |
| 2 | Germany | 0.3869 | 38.7 | 0.3465 | €1,354 |
| 3 | Belgium | 0.3499 | 35.0 | 0.3117 | €1,225 |
| 4 | Denmark | 0.3312 | 33.1 | 0.2534 | €1,159 |
| 5 | Austria | 0.3272 | 32.7 | 0.2850 | €1,145 |
| 6 | Czechia | 0.3217 | 32.2 | 0.3865 | €1,126 |
| 7 | Liechtenstein | 0.3062 | 30.6 | — | €1,072 |
| 8 | Italy | 0.2966 | 29.7 | 0.3101 | €1,038 |
| 9 | Romania | 0.2893 | 28.9 | 0.4952 | €1,013 |
| 10 | Cyprus | 0.2774 | 27.7 | 0.3037 | €971 |
| 11 | Sweden | 0.2711 | 27.1 | 0.2225 | €949 |
| 12 | Poland | 0.2709 | 27.1 | 0.3715 | €948 |
| 13 | Spain | 0.2669 | 26.7 | 0.2975 | €934 |
| 14 | Luxembourg | 0.2665 | 26.7 | 0.2019 | €933 |
| 15 | France | 0.2561 | 25.6 | 0.2352 | €896 |
| 16 | Netherlands | 0.2558 | 25.6 | 0.2182 | €895 |
| 17 | Latvia | 0.2452 | 24.5 | 0.3182 | €858 |
| 18 | Portugal | 0.2435 | 24.3 | 0.2953 | €852 |
| 19 | Greece | 0.2381 | 23.8 | 0.2930 | €833 |
| 20 | Estonia | 0.2303 | 23.0 | 0.2519 | €806 |
| 21 | Finland | 0.2254 | 22.5 | 0.1877 | €789 |
| 22 | Slovenia | 0.2121 | 21.2 | 0.2431 | €742 |
| 23 | Moldova | 0.1967 | 19.7 | — | €688 |
| 24 | Lithuania | 0.1955 | 19.6 | 0.2502 | €684 |
| 25 | Norway | 0.1922 | 19.2 | 0.1564 | €673 |
| 26 | Slovakia | 0.1853 | 18.5 | 0.2311 | €649 |
| 27 | Croatia | 0.1658 | 16.6 | 0.2326 | €580 |
| 28 | Bulgaria | 0.1355 | 13.6 | 0.2208 | €474 |
| 29 | Malta | 0.1282 | 12.8 | 0.1409 | €449 |
| 30 | Serbia | 0.1190 | 11.9 | 0.1939 | €416 |
| 31 | Albania | 0.1175 | 11.8 | 0.1834 | €411 |
| 32 | North Macedonia | 0.1161 | 11.6 | 0.2292 | €406 |
| 33 | Hungary | 0.1082 | 10.8 | 0.1510 | €379 |
| 34 | Montenegro | 0.0998 | 10.0 | 0.1779 | €349 |
| 35 | Bosnia and Herzegovina | 0.0966 | 9.7 | 0.1637 | €338 |
| 36 | Kosovo | 0.0877 | 8.8 | — | €307 |
| 37 | Georgia | 0.0731 | 7.3 | — | €256 |
| 38 | Türkiye | 0.0636 | 6.4 | 0.1702 | €223 |
Household consumers, band DC (2 500 to 4 999 kWh a year), all taxes and levies included. A dash means Eurostat publishes no purchasing power standard for that country. Source: Eurostat, nrg_pc_204, second half of 2025.
The number worth sitting with is not the top of either table. It is Louisiana, which sells the fourth-cheapest kilowatt-hour in the country at 13.49 cents, and whose average household still spends about $1,946 a year on electricity — within eight dollars of Maine, where the same unit costs 29.59 cents. Cheap power and a 14,400 kilowatt-hour habit land in the same place as expensive power and a 6,600 kilowatt-hour one.
Direction of travel is easier to read: 46 of the 51 US jurisdictions were more expensive in June 2026 than in June 2025. Hawaii moved most, from 40.96 to 52.72 cents, and Massachusetts was one of the five that fell.
Where the Expensive Kilowatt-Hours Are
Both maps are schematic: one square per place, arranged roughly by geography so no square hides behind a small one. The color band is the price, and the number printed on each square is the price itself.
The American pattern is coastal. Every New England state, New York, California, Alaska and Hawaii sit in the two most expensive bands. The interior South, the Plains and the Mountain West sit in the two cheapest, apart from Colorado at 17.13 cents and Minnesota at 17.52, which sit one band up. Hawaii stands apart from all of them, because almost every kilowatt-hour on the islands starts as imported liquid fuel.
The European gradient runs the other way round: dearest in the north and west, cheapest in the south-east. Ireland, Germany, Belgium, Denmark, Austria and Czechia all clear 30 euro cents, while the Western Balkans, Türkiye and Georgia sit under 12.
Part of that gradient is policy rather than generation. Eurostat put taxes and levies at 28.9 percent of the European Union household price in the second half of 2025, up 1.3 percentage points on the half-year before, so nearly three cents in every ten are decided by a legislature rather than by a power station.
The Price Changes Again When You Divide by the Wage
A euro does not buy the same amount of daily life in every country, so Eurostat publishes the same prices a second time in purchasing power standards, an artificial unit worth the same basket of goods everywhere. That column sits in the European table above, and it rearranges the ranking.
Romania sells the ninth most expensive kilowatt-hour in Europe at €0.2893, and the most expensive one in Europe at 0.4952 purchasing power standards. Poland moves from twelfth to third, Latvia from seventeenth to sixth. Denmark falls from fourth to fourteenth, Luxembourg from fourteenth to twenty-fifth, Sweden from eleventh to twenty-second.
Malta travels the other way. It sells the tenth cheapest kilowatt-hour in Europe in euro and the cheapest of all in purchasing power standards. Norway, mid-table at €0.1922, comes third cheapest once local buying power is applied.
Inside the United States the equivalent correction is the annual bill column rather than a wage index, and it reshuffles the map the same way. Anyone weighing a battery, a generator or an array is comparing what leaves the account each year, and that ranking is not the price ranking.
What It Costs to Store a Kilowatt-Hour Instead
A home battery does not make electricity. It buys a kilowatt-hour when the meter is cheap, keeps most of it, and hands it back when the meter is expensive — so its economics are decided by two numbers on this page: what the local kilowatt-hour costs, and how far apart the cheap and expensive hours are.
The cost of storing a unit comes off the datasheet. Take the installed price, divide by the energy the pack is warranted to deliver over its life, then add what you lose in the round trip. Enphase’s IQ Battery 5P datasheet, revision May 2025, carries all three figures: 5.0 kilowatt-hours usable, 90 percent round-trip efficiency, and a warranty running to 15 years or 6,000 cycles.
Set your own numbers below. The output is the gap your tariff has to open up between its cheap and expensive hours before the battery pays for the storing.
COST OF STORING ONE kWh
0 ¢
LOST IN THE ROUND TRIP
0 ¢
SPREAD YOUR TARIFF MUST BEAT
0 ¢
ENERGY OVER THE WARRANTY
0 kWh
The price field starts at the June 2026 US average of 18.34 cents. The cost and capacity fields start at EnergySage’s marketplace figure of 26 August 2026 — $1,159 per kilowatt-hour, quoted against a 13.5 kilowatt-hour pack at $15,647 installed — and the cycle and efficiency fields at the Enphase warranty and datasheet figures above. Replace all five with your own quote.
COST OF STORING ONE kWh
€0
LOST IN THE ROUND TRIP
€0
SPREAD YOUR TARIFF MUST BEAT
€0
ENERGY OVER THE WARRANTY
0 kWh
The price field starts at the European Union average of €0.2896 for the second half of 2025. No agency publishes a continent-wide installed price for home batteries the way Eurostat publishes electricity prices, so the first field is left for the figure on your own quotation.
Run the default US numbers and the answer is uncomfortable: storing a kilowatt-hour in a battery bought at the current marketplace average costs about 19 cents before you have paid for the electricity itself, and the tariff has to open a gap of roughly 21 cents between its cheap and expensive hours before the shifting pays. Very few residential tariffs on either continent do that.
A battery bought purely to shift the meter is a hard sale at 2026 prices. A battery bought to keep the house running when the grid stops, or to hold onto solar you would otherwise export cheaply, is a different purchase with different arithmetic — see the generator against home battery comparison and the payback period breakdown.
Method, Sources and Refresh
US prices are the residential sector column of Table 5.6.A of the Electric Power Monthly, data month June 2026, released 26 August 2026, covering all 50 states and the District of Columbia. Typical annual consumption is the 2024 average monthly figure per residential customer from Table 5A of Electric Sales, Revenue, and Average Price, built from Form EIA-861, multiplied by twelve. The annual cost column is an indicative bill at today’s price, not a bill anyone received.
European prices are Eurostat series nrg_pc_204 for the second half of 2025, extracted 12 August 2026: household consumers, consumption band DC of 2 500 to 4 999 kilowatt-hours a year, all taxes and levies included, in euro and in purchasing power standards. The collection covers 38 countries including Moldova, Georgia and Türkiye, which sit at the edges of Europe; Iceland, Ukraine and the United Kingdom reported no figure for that half-year, and Switzerland is outside the collection, so all five are absent from the table and the map rather than estimated.
For the United Kingdom the nearest published equivalent is a cap rather than an observed average. Ofgem’s default tariff cap for 1 October to 31 December 2026 sets the electricity unit rate at 26.32 pence per kilowatt-hour on the national average for a direct debit customer, alongside a 54.83 pence daily standing charge. Different measurement, so it is not ranked here.
A monthly US price and a half-yearly European one cannot be forced into the same instant. Both are the latest each agency has published, both are dated, and neither is converted into the other’s currency, because one day’s exchange rate would add a movement that has nothing to do with electricity.
Verified September 2026 against the published Electric Power Monthly table and the Eurostat data browser series. The full table for both continents is available as data.csv. This page is refreshed twice a year, after each Eurostat half-year release and against whichever Electric Power Monthly is current at that point; the maps and the ranking columns are rebuilt from the same file.
Common questions
Why is the US figure monthly and the European figure half-yearly?
They are collected differently. The Energy Information Administration gathers revenue and sales from utilities every month and publishes a state price about eight weeks later. Eurostat reconciles returns from dozens of national regulators and publishes in half-year blocks, roughly six months after the period ends.
Does the price on my bill match the price in these tables?
Rarely, though neither figure is wrong. Both figures are total revenue divided by total kilowatt-hours sold, so they fold in standing charges, fixed fees and every tariff in the state or country at once. Your own effective price is your bill divided by your metered kilowatt-hours, and it moves with how much you use.
Why does the cheapest kilowatt-hour not give the cheapest bill?
Because consumption is not held constant. The 2024 state averages behind the tables run from about 5,900 kilowatt-hours a year in Hawaii to about 14,400 in Louisiana, a spread wider than the price spread. Electric heating, air conditioning, house size and climate decide the quantity, and the quantity often outweighs the unit price.
Should a high price on this page push me toward a battery?
Only alongside a wide gap between your cheap and expensive hours, or an outage record that makes stored energy worth having on its own. Work the calculator above with your own quote first: at 2026 installed prices, storing a kilowatt-hour costs about what buying one does in most of these places.
Sources: Energy Information Administration, Electric Power Monthly, Table 5.6.A, data month June 2026, released 26 August 2026; Energy Information Administration, Electric Sales, Revenue, and Average Price, Table 5A, 2024, from Form EIA-861; Eurostat, Electricity prices for household consumers, series nrg_pc_204, second half of 2025, extracted 12 August 2026; Eurostat, Electricity price statistics, Statistics Explained; Energy Information Administration, Residential Energy Consumption Survey 2020, Use of energy in homes; Enphase IQ Battery 5P datasheet, DSH-00010-11.0-EN, revision May 2025; EnergySage home battery cost data, 26 August 2026; Ofgem, energy price cap unit rates and standing charges, 1 October to 31 December 2026.