


The short answer
About a third of an array's paper output never reaches a socket. PVWatts and PVGIS both default to roughly 14% before storage is involved; add temperature, battery round-trip, inverter conversion, idle draw and phantom loads and a worked 4 kW off-grid chain delivers about 66%. Size the array against delivered kilowatt-hours, and attack the biggest slice first.
Our position
Where solar actually fits
A small array keeping one protected circuit alive — the fridge, comms, a pump — is solar doing what it does best. Asking it to carry the whole house is how five-figure systems end up babysat by a generator every December. Size the essentials circuit first; choose the main system from there.
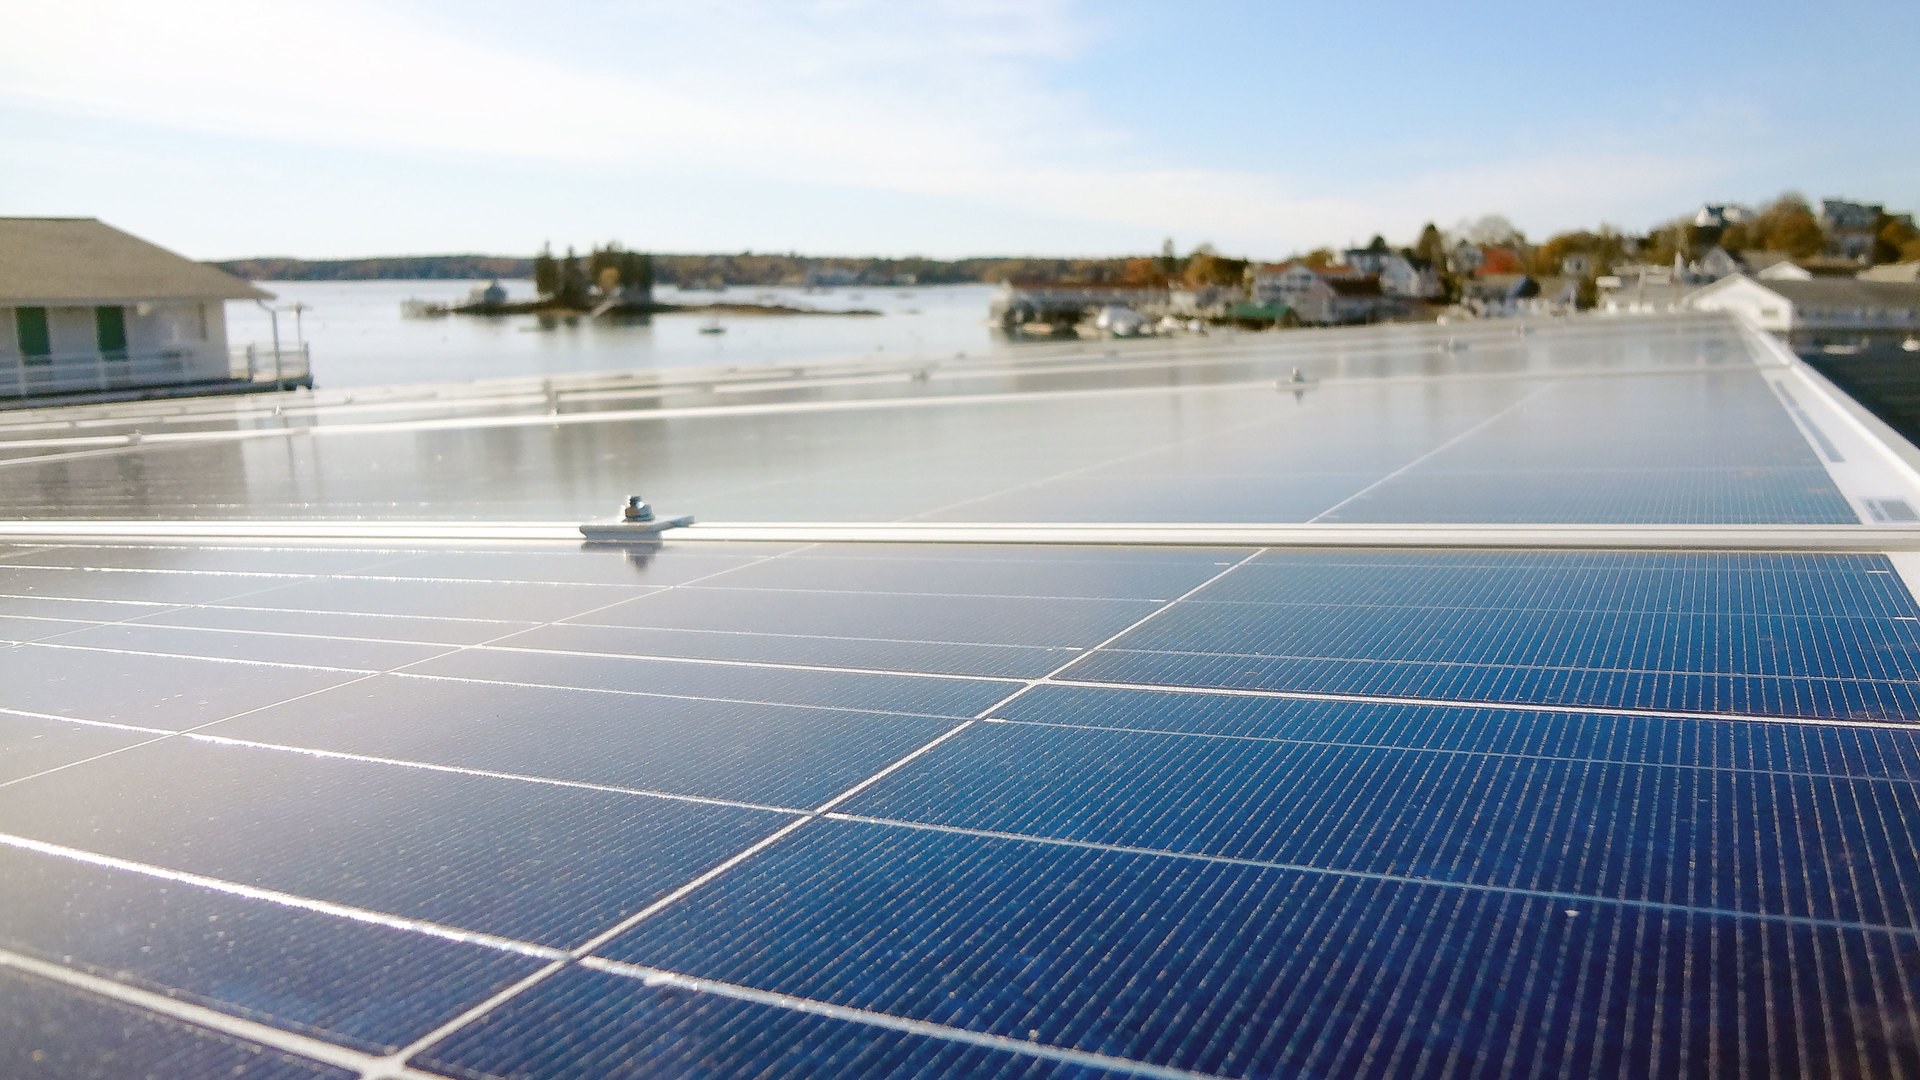
A solar panel is sold by a number measured in a laboratory, at 25°C, on clean glass, under a calibrated light source. Your roof is not that laboratory. Between the sticker on the back of the module and the bread going brown in your toaster sits a chain of small subtractions, none of them dramatic, all of them permanent.
Nobody hides them. They are printed on datasheets and built into the modeling tools engineers use every day. They get skipped in the sales conversation because each one is small and the sum is not.
Key number
Two of the world's standard modeling tools land in almost the same place before the battery is even in the picture.
The default loss set in NREL's PVWatts model comes to 14.08% when its ten factors are multiplied together, and the European Commission's PVGIS tool uses a flat 14% default for cables, inverter and dirt.
Add temperature, storage and standby draw, and a realistic off-grid chain lands near one third of the array's paper output.
The chain from photon to toast
Every loss below is multiplicative. Each takes its cut of whatever the previous step handed on, which is why nine modest percentages do not add up to a modest total. The diagram traces one worked example: a 4 kW array at 4.5 peak sun hours, running through a charge controller, a battery and an inverter to household loads.
Free calculator
Solar Sizing Calculator
Daily kWh in, array kW, panel count, battery bank and inverter size out. Live, free, no sign-up — and the result becomes a brief you can buy against.
Losses at the glass: heat, dirt, shade and mismatch
The first four subtractions happen before the electricity has traveled a single meter of cable.
Temperature is the largest and the least intuitive. A silicon cell makes less power as it warms, because open-circuit voltage falls by roughly 2.2 millivolts per degree Celsius. Current creeps up by about 0.06% per degree, nowhere near enough to compensate, so maximum power falls by 0.4% to 0.5% per degree for a plain silicon cell.
Those figures are the PVEducation reference maintained by the University of New South Wales and Arizona State University, and they describe a bare cell. Your own modules publish a gentler slope, under the heading temperature coefficient of Pmax.
Ratings are set at a cell temperature of 25°C. Dark modules on a still roof in summer run far above the air temperature, so the loss is real for a large part of the year. PVGIS assumes an 8% temperature-related power loss when it does not know what technology is on the roof, a generic value the manual describes as reasonable for temperate climates.
Soiling is dust, pollen, salt, bird mess and the dark line of grime along the bottom rail. PVWatts defaults to 2%, which suits a rainy climate and a tilt steep enough to shed water. A dry, dusty or agricultural site with a shallow tilt loses far more between washes.
Shading defaults to 3%, which assumes a site chosen with care. A chimney, a vent stack or one branch clipping a string in late afternoon moves it far higher, because a shaded cell drags down the whole string it sits in.
Mismatch is the tax on wiring many cells and modules into one circuit. No two are identical, and a series string runs at the current of its weakest member. PVWatts assigns 2% to mismatch, 2% to wiring, 0.5% to connections, 1.5% to light-induced degradation in the first weeks of exposure, and 1% to the gap between the label and the module's measured output.
| Loss | PVWatts default | What moves it |
|---|---|---|
| Soiling | 2% | Rainfall, tilt, dust, pollen, farm and road grit |
| Shading | 3% | Trees, chimneys, vents, neighboring roofs, winter sun angle |
| Snow | 0% | Anything above the snow belt; steep tilt sheds faster |
| Mismatch | 2% | Cell and module spread within a string |
| Wiring | 2% | Conductor size, run length, system voltage |
| Connections | 0.5% | Connector quality, corrosion, torque |
| Light-induced degradation | 1.5% | Cell chemistry, first weeks of exposure |
| Nameplate rating | 1% | Manufacturing tolerance against the label |
| Age | 0% | PVWatts leaves this at zero for year one; Fraunhofer ISE uses 0.70% a year over a system life |
| Availability | 3% | Downtime for faults and maintenance |
| Combined | 14.08% | Product of the ten factors |
Default loss values from NREL's PVWatts Version 5 model, as implemented and documented in the open-source pvlib library. The combined figure is the product of the ten factors rather than their sum.
Losses in the wire and the charge controller
Copper resistance turns a slice of every watt into heat, and the loss rises with the square of the current. System voltage therefore matters more than cable price.
On a 120 V circuit, moving a given number of watts needs roughly twice the current of the same load at 230 V, and twice the current in the same conductor means four times the heating loss.
The 3% branch-circuit and 5% overall voltage-drop figures people quote are Informational Note No. 4 to NEC 210.19(A) and Informational Note No. 2 to 215.2(A)(1) in the 2023 code, which is guidance rather than an enforceable article. The same arithmetic is why off-grid battery banks moved from 12 V to 24 V and 48 V as systems grew.
A 230 V circuit carries about half the current of a 120 V circuit for the same load, so it wastes about a quarter as much energy in the same conductor. European practice sizes cables under IEC 60364 with a similar few-percent drop target. The same arithmetic is why off-grid battery banks moved from 12 V to 24 V and 48 V as systems grew.
Our DC wire size calculator turns that into a gauge for a specific run, which is worth doing before the cable is bought.
The charge controller is the good news here. A maximum power point tracker hunts for the voltage and current where the array's product of the two is highest, then converts surplus voltage into charging current. Morningstar's TriStar MPPT datasheet quotes 99% peak efficiency; because conversion efficiency falls away at low power, a day's average lands closer to 95% to 98%.
Losses in the battery: round-trip by chemistry
Energy that goes into storage and comes back out pays a toll twice, once charging and once discharging. The combined figure is round-trip efficiency, and it varies by chemistry more than any other number on this page.

The Department of Energy's storage cost and performance assessment, published by Pacific Northwest National Laboratory in August 2022, reports it at the direct-current terminals and again after conversion.
Lithium iron phosphate and nickel manganese cobalt both come in at 89.55% direct-current round-trip, dropping to 86% once a two-way inverter is included. Lead-acid runs from 77% at short durations to 87% at very long ones, or 74% to 84% with the inverter.
| Chemistry | Round-trip, DC to DC | Round-trip through an inverter | Note |
|---|---|---|---|
| Lithium iron phosphate (LiFePO4) | 89.6% | 86% | Little penalty for fast charge or deep discharge |
| Nickel manganese cobalt (NMC) | 89.6% | 86% | Same efficiency, different cycle life and thermal behavior |
| Lead-acid, short duration (2–4 h) | 77–79% | 74–76% | Worse the harder you charge it |
| Lead-acid, long duration (8–24 h) | 84–86% | 81–83% | Gentle, long charges lose less to gassing and heat |
Round-trip efficiency values for 2021 systems, Energy Storage Grand Challenge Cost and Performance Assessment 2022, PNNL-33283, August 2022. These are utility-scale systems; household units sit in the same band and the ordering between chemistries is the same.
Two consequences follow. The loss applies only to energy that actually goes through the battery, so power used while the sun is on the roof skips the toll entirely. And a lead-acid bank charged hard in a short winter window is working at the worst end of its own range.
Chemistry choice is a longer conversation than this page: see the battery chemistry comparison and the guide to sizing a bank in LiFePO4 or lead-acid.
Losses in the inverter, awake all night
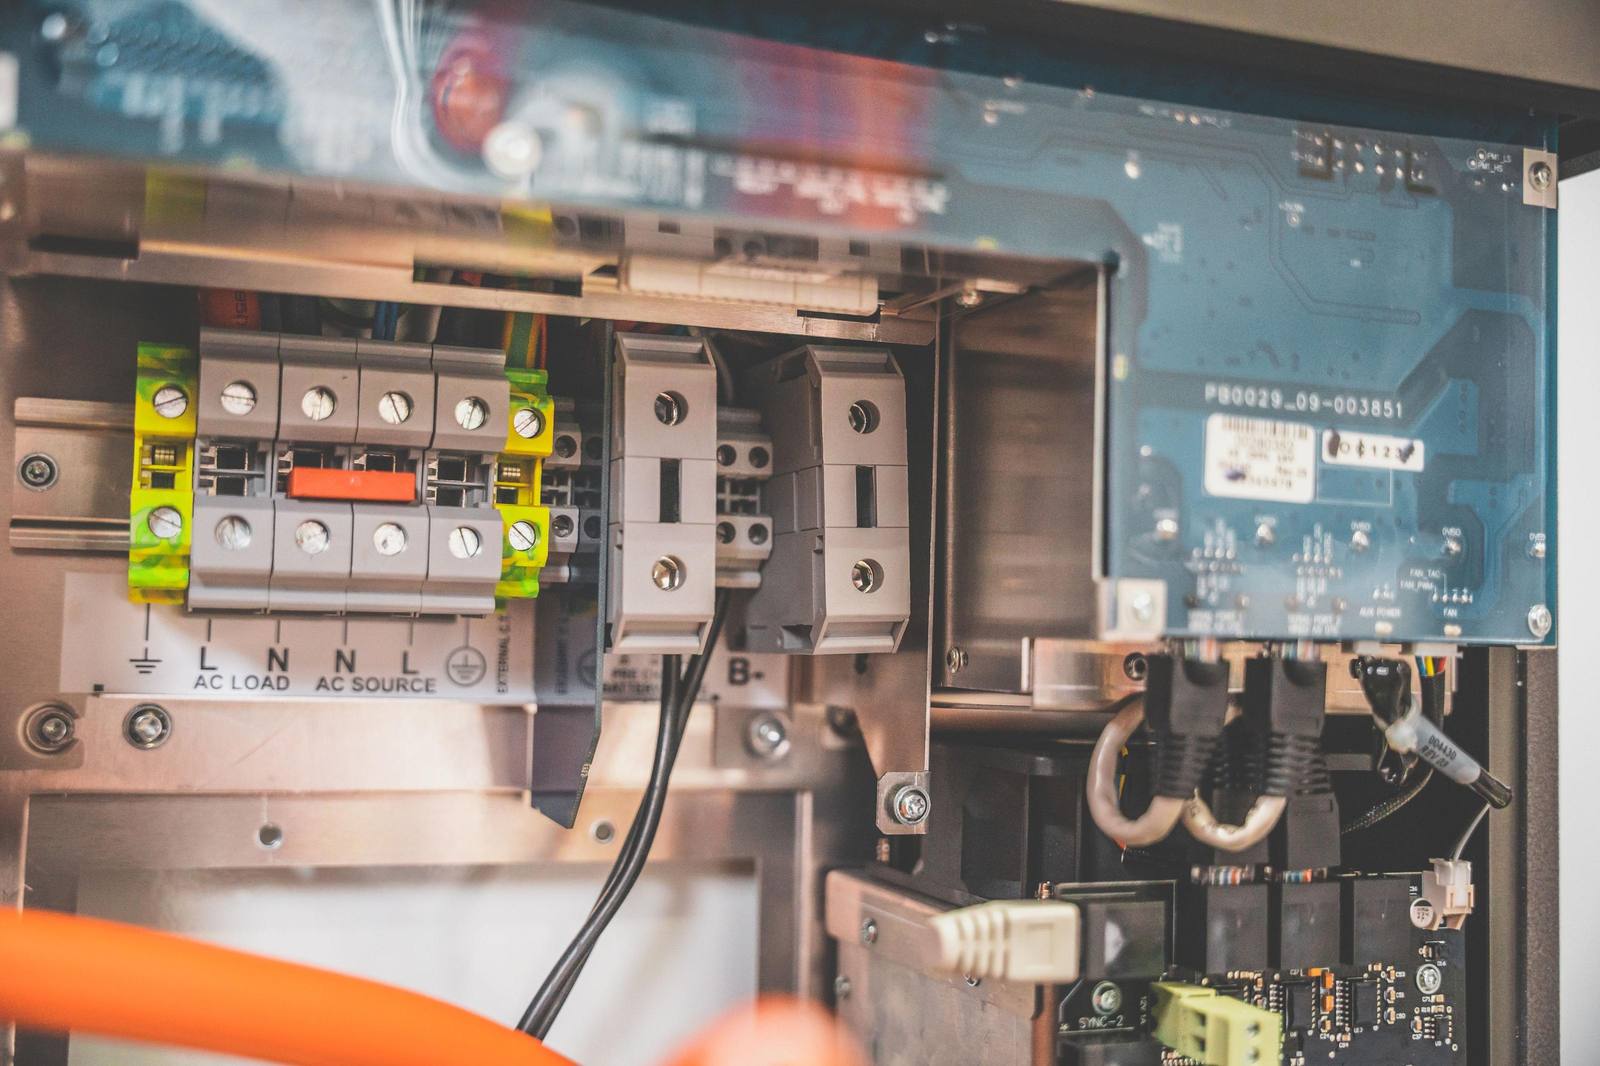
An inverter takes direct current from the battery and builds alternating current for the house. It costs a percentage while it works, and a fixed number of watts simply for being awake.
Victron's MultiPlus-II datasheets list maximum efficiency between 93% and 96% across the model range, with the higher-voltage units at the better end, because a 48 V unit moves the same power at a quarter of the current of a 12 V one.
Peak efficiency is measured near rated load. The PVWatts inverter model carries a term that falls away sharply as output drops toward zero, so an oversized inverter running a laptop and a lamp sits well below its headline number.
The fixed cost is the one that quietly empties batteries. The same datasheets list zero-load power of 11 W to 24 W across the 120 V range and up to 55 W on the largest 230 V units. Search mode, where the inverter pulses and sleeps until it detects a load, brings that down to 2 W to 6 W.
| Inverter state | Typical draw | Over 24 hours |
|---|---|---|
| Zero-load, always on, small unit | 11–13 W | 0.26–0.31 kWh |
| Zero-load, always on, large unit | 29–55 W | 0.70–1.32 kWh |
| Energy-saving mode | 7–19 W | 0.17–0.46 kWh |
| Search mode, waiting for a load | 2–6 W | 0.05–0.14 kWh |
Zero-load and search-mode figures from Victron MultiPlus-II 120 V and 230 V datasheets, September 2026. Other manufacturers publish the same specification under names like tare loss or no-load consumption.
An oversized inverter is an expensive night light. A 15 kVA unit idling at 55 W burns 1.3 kWh a day doing nothing at all, which on a small off-grid system can be a tenth of everything the roof made. Sizing it against the load rather than the ambition is covered in our guide to inverter and charger sizing.
Phantom loads: the last slice
The final subtraction happens past the socket, in devices that never truly switch off: a television waiting for a remote, a console in rest mode, a microwave lighting a clock, a router, a doorbell transformer, half a dozen chargers with nothing plugged into them.
Individually these are trivial. Collectively they run every hour of every day, which is what makes them expensive on a fixed daily budget. Thirty watts held around the clock is 0.72 kWh a day, roughly one useful hour of a 4 kW array.
Grid-connected, that is a line on a bill. Off-grid, it is battery capacity you bought and are spending on standby lights. Our appliance wattage chart lists running and standby figures device by device.
Set your own numbers
Change any input and the chain recomputes. Watch which single number moves the total most for your own situation.
Derate calculator
Array output on paper
18.0 kWhDelivered to loads
11.8 kWhTotal derate
34.3%Biggest single loss
TemperatureEvery 10 kWh the array makes on paper delivers 6.6 kWh at a socket.
| Step | Lost | Share of paper output |
|---|---|---|
| Temperature | ||
| Soiling | ||
| Shading | ||
| Mismatch, wiring, connections | ||
| Charge controller | ||
| Battery round-trip | ||
| Inverter idle | ||
| Inverter conversion | ||
| Phantom loads |
Losses apply in the order shown, each taking its share of what the previous step passed on. Battery round-trip applies only to the stored share.
Once you have a derate you believe, feed it forward. The off-grid solar sizing calculator works from the load you need at the socket back to the array and battery that deliver it, and a system sized on paper watts alone comes up short by exactly the gap this page measures.
What the derate means when you size a system
The chain above is the same arithmetic the industry uses on itself. Fraunhofer ISE's Photovoltaics Report of 14 July 2026 harmonizes its payback-time figures on an initial performance ratio of 80%, degradation of 0.70% a year and a 25-year life, which averages out at 73.6%.
That is a grid-connected system with no battery and no off-grid inverter in it. Add both and the mid-sixties result above stops looking harsh.
The rules that fall out of it are short.
- Size the array against delivered kilowatt-hours, never against the nameplate on the modules.
- Attack the biggest slice first. On most systems that is temperature or shade, and on small systems it is often inverter idle.
- Use energy while the sun is up. Anything not stored skips the round-trip toll completely.
- Pick the inverter for the load you actually run rather than the one you imagine. Idle draw is charged every hour of every day.
- Raise system voltage before buying thicker cable. Halving the current quarters the heating loss.
One last piece of arithmetic. A 1,000 W toaster running four minutes uses 0.067 kWh, so at the delivery share in the worked example the array has to make about 0.10 kWh on paper to put that toast on the plate. The missing third went into warm glass, dusty cells, warm copper, a warm battery, and an inverter humming to itself at three in the morning.
Common questions
Why do the loss percentages multiply instead of adding up?
Because each step only ever sees what the previous one passed on. A 3% shading loss applied after an 8% temperature loss removes 3% of the remaining 92%. That is why the ten PVWatts factors give 14.08% rather than the 15% you get by adding them up.
Is the temperature loss the same everywhere?
No. It scales with how far the cell runs above its 25°C rating, so a hot, still, dark roof in a low-latitude summer loses far more than a cool, breezy site or a ground mount with air on both faces. PVGIS uses 8% as its generic annual figure when the module technology is unknown; your module's temperature coefficient of Pmax gives a site-specific answer.
Does a battery always cost me its round-trip efficiency?
Only on the energy that actually goes through it. Loads running while the array is producing are supplied directly and pay nothing. Shifting laundry, water heating, pumping and tool charging into the middle of the day is the cheapest efficiency upgrade available, because it removes the toll rather than reducing it.
Do microinverters or optimizers remove any of these losses?
They target one of them. Module-level electronics cut the mismatch and partial-shading penalty by letting each module find its own operating point instead of being dragged by the weakest in a string. Temperature, soiling, wiring, battery round-trip and standby draw are untouched, so the effect on an unshaded array is real but modest.
Sources: NREL, PVWatts Version 5 Manual (NREL/TP-6A20-62641, 2014), default loss set and inverter model as implemented in the open-source pvlib library; European Commission Joint Research Center, PVGIS user manual, default 14% system loss; PVEducation (University of New South Wales and Arizona State University), temperature effects on silicon cells; Pacific Northwest National Laboratory, Energy Storage Grand Challenge Cost and Performance Assessment 2022 (PNNL-33283, August 2022), round-trip efficiency tables; Victron Energy MultiPlus-II 120 V and 230 V datasheets; Morningstar TriStar MPPT specifications; Fraunhofer ISE, Photovoltaics Report (14 July 2026), performance ratio and degradation; National Electrical Code informational notes to 210.19(A) and 215.2(A)(1) on voltage drop.