


The short answer
Size an off-grid array on December, not on the annual average, because nothing stores July for January. The same 6 kWh household needs 1.39 kW of panel in Phoenix and 4.88 kW in Seattle once December sets the number. Tilt to roughly latitude plus 15 degrees, size the bank on the worst week rather than the month, and treat a winter generator as the alternative to the last few panels.
Our position
Where solar actually fits
A small array keeping one protected circuit alive — the fridge, comms, a pump — is solar doing what it does best. Asking it to carry the whole house is how five-figure systems end up babysat by a generator every December. Size the essentials circuit first; choose the main system from there.
A solar array has one job in July: throw away most of what it makes. Its real work happens in the eight weeks around the winter solstice, when the sun clears the trees for a few hours and hands over a fraction of what the same panels collected in June.
Everything else about an off-grid design — panel count, tilt, the size of the bank, whether there is a generator at all — falls out of that one month.
Designers call it the design month. In the northern hemisphere it is almost always December, and it is why two houses with identical appetites, one in Arizona and one in Washington, end up with systems that look nothing alike.
Key number
Take one 6 kWh-a-day household and move it. On the annual average, Phoenix needs 1.37 kW of panel and Seattle 2.32 kW — under two to one. On December, array tilted for winter, Phoenix needs 1.39 kW and Seattle 4.88 kW. The move that added 70% to the annual number adds 250% to the December one. PVGIS, retrieved September 2026.
The annual average is a grid-tied number
A grid-tied array runs a yearly balance sheet. June's surplus goes out to the utility, December's shortfall comes back in, and the two settle once a year. The annual average is exactly the right basis for sizing that, because the grid is quietly acting as an infinite seasonal battery.
An off-grid system has no counterparty. Every kilowatt-hour burned in December had to be made in December, on site. There is no account to draw down.
Batteries do not close the gap either. A bank is sized in days, typically one to four; a seasonal shortfall runs eight to twelve weeks. Nothing in a normal bank stores July for January.
So the array is sized on the worst month and the other eleven run in deliberate surplus. An off-grid system not throwing power away in June was built too small.
Free calculator
Solar Sizing Calculator
Daily kWh in, array kW, panel count, battery bank and inverter size out. Live, free, no sign-up — and the result becomes a brief you can buy against.
One load, five latitudes, five different systems
The same household at five real places: 6 kWh a day, the 25% system losses the off-grid solar sizing calculator uses by default, array pointed at the equator. The annual column is each site's yearly average of horizontal irradiation; the December column is in-plane irradiation at latitude plus 15 degrees.
| Site | Latitude | Annual average kWh/m²/day | December, winter tilt kWh/m²/day | Array on the annual number | Array on December |
|---|---|---|---|---|---|
| Phoenix, Arizona | 33.4°N | 5.85 | 5.74 | 1.37 kW | 1.39 kW |
| Denver, Colorado | 39.7°N | 4.82 | 4.65 | 1.66 kW | 1.72 kW |
| Madrid, Spain | 40.4°N | 4.87 | 4.48 | 1.64 kW | 1.79 kW |
| Seattle, Washington | 47.6°N | 3.45 | 1.64 | 2.32 kW | 4.88 kW |
| Tromsø, Norway | 69.6°N | 1.95 | 0.00 | 4.10 kW | no finite answer |
US sites: PVGIS 5.2 on the National Solar Radiation Database, 2005–2015. Madrid: PVGIS 5.3 on CM SAF SARAH-3, 2005–2023. Tromsø: PVGIS 5.3 on ERA5, 2005–2023. Retrieved 2 September 2026.
Read the last two columns across and the geography of off-grid solar appears. Phoenix, Denver and Madrid barely move, because a steep winter tilt hands back nearly everything the season took. Seattle more than doubles. Tromsø leaves the arithmetic entirely.
That Seattle jump is what northern builds miss. Price a system off an annual figure, buy 2.3 kW of panel, and by mid-December the bank has not reached full charge in a month.
What December does to the battery bank
Sizing the array on December fixes the average. It does not fix the runs of dark days December is full of, and that is what the bank is for.
Our battery autonomy report runs 19 winters of daily satellite irradiance through a simulated bank at every US state and European country, taking the one-in-ten winter drawdown as the design figure. For the same household at 80% depth of discharge:
| Reference point | Design days of autonomy | Usable storage needed | Nameplate bank at 80% depth |
|---|---|---|---|
| Arizona | 2.0 | 12 kWh | 15 kWh |
| Colorado | 1.5 | 9 kWh | 11 kWh |
| Washington | 3.0 | 18 kWh | 23 kWh |
| Spain | 4.0 | 24 kWh | 30 kWh |
Design days from the Grid CEO battery autonomy report, built on NASA POWER daily all-sky irradiance, 2001–2020. US figures use each state's 2020 census center of population; European figures use the capital, so Spain is Madrid and Norway is Oslo rather than Tromsø.
Spain sits above Washington there, which looks wrong until you see what the figure measures. Every site in that report gets an array sized to its own darkest month, so the bank insures against the gap between a bad spell and that site's own normal rather than against low sun in general.
The same inversion turns up inside the US: Texas gets more than twice Oregon's December sun and still lands at 4.5 design days against Oregon's 5.5, because a bright December buys a small array with nothing spare when the sky closes.
So Seattle gets a large array and a moderate bank, Madrid a small array and the biggest bank of the four. Two different failure modes, and no single rule of thumb reaches both.
December's floor drops further than its average
Averages hide the part that empties a battery. Run five years of PVGIS hourly output through a winter-tilted array and find the worst five-day stretch in each month.
| Site | Worst 5-day stretch in December share of that month's average | Worst 5-day stretch in June share of that month's average |
|---|---|---|
| Phoenix | 38% | 89% |
| Denver | 62% | 72% |
| Madrid | 31% | 67% |
| Seattle | 9% | 59% |
| Tromsø | 0% | 40% |
Calculated from PVGIS 5.3 hourly output, 2019–2023, fixed array at latitude plus 15 degrees, 14% system losses: ERA5 for the US sites and Tromsø, CM SAF SARAH-3 for Madrid. Each figure is the worst run of five consecutive days in that month, as a share of the same month's own five-year average. Retrieved 2 September 2026.
Seattle's worst December stretch runs at 9% of an already small December average. An array sized to that average covers about a tenth of the load across those five days, and the bank carries the rest of the house.
Phoenix has the opposite shape: a December average within 2% of its annual one, and a worst five-day stretch at 38% of it. Even a bright site needs a bank sized on its bad week.
Tilt is the cheapest change you can make
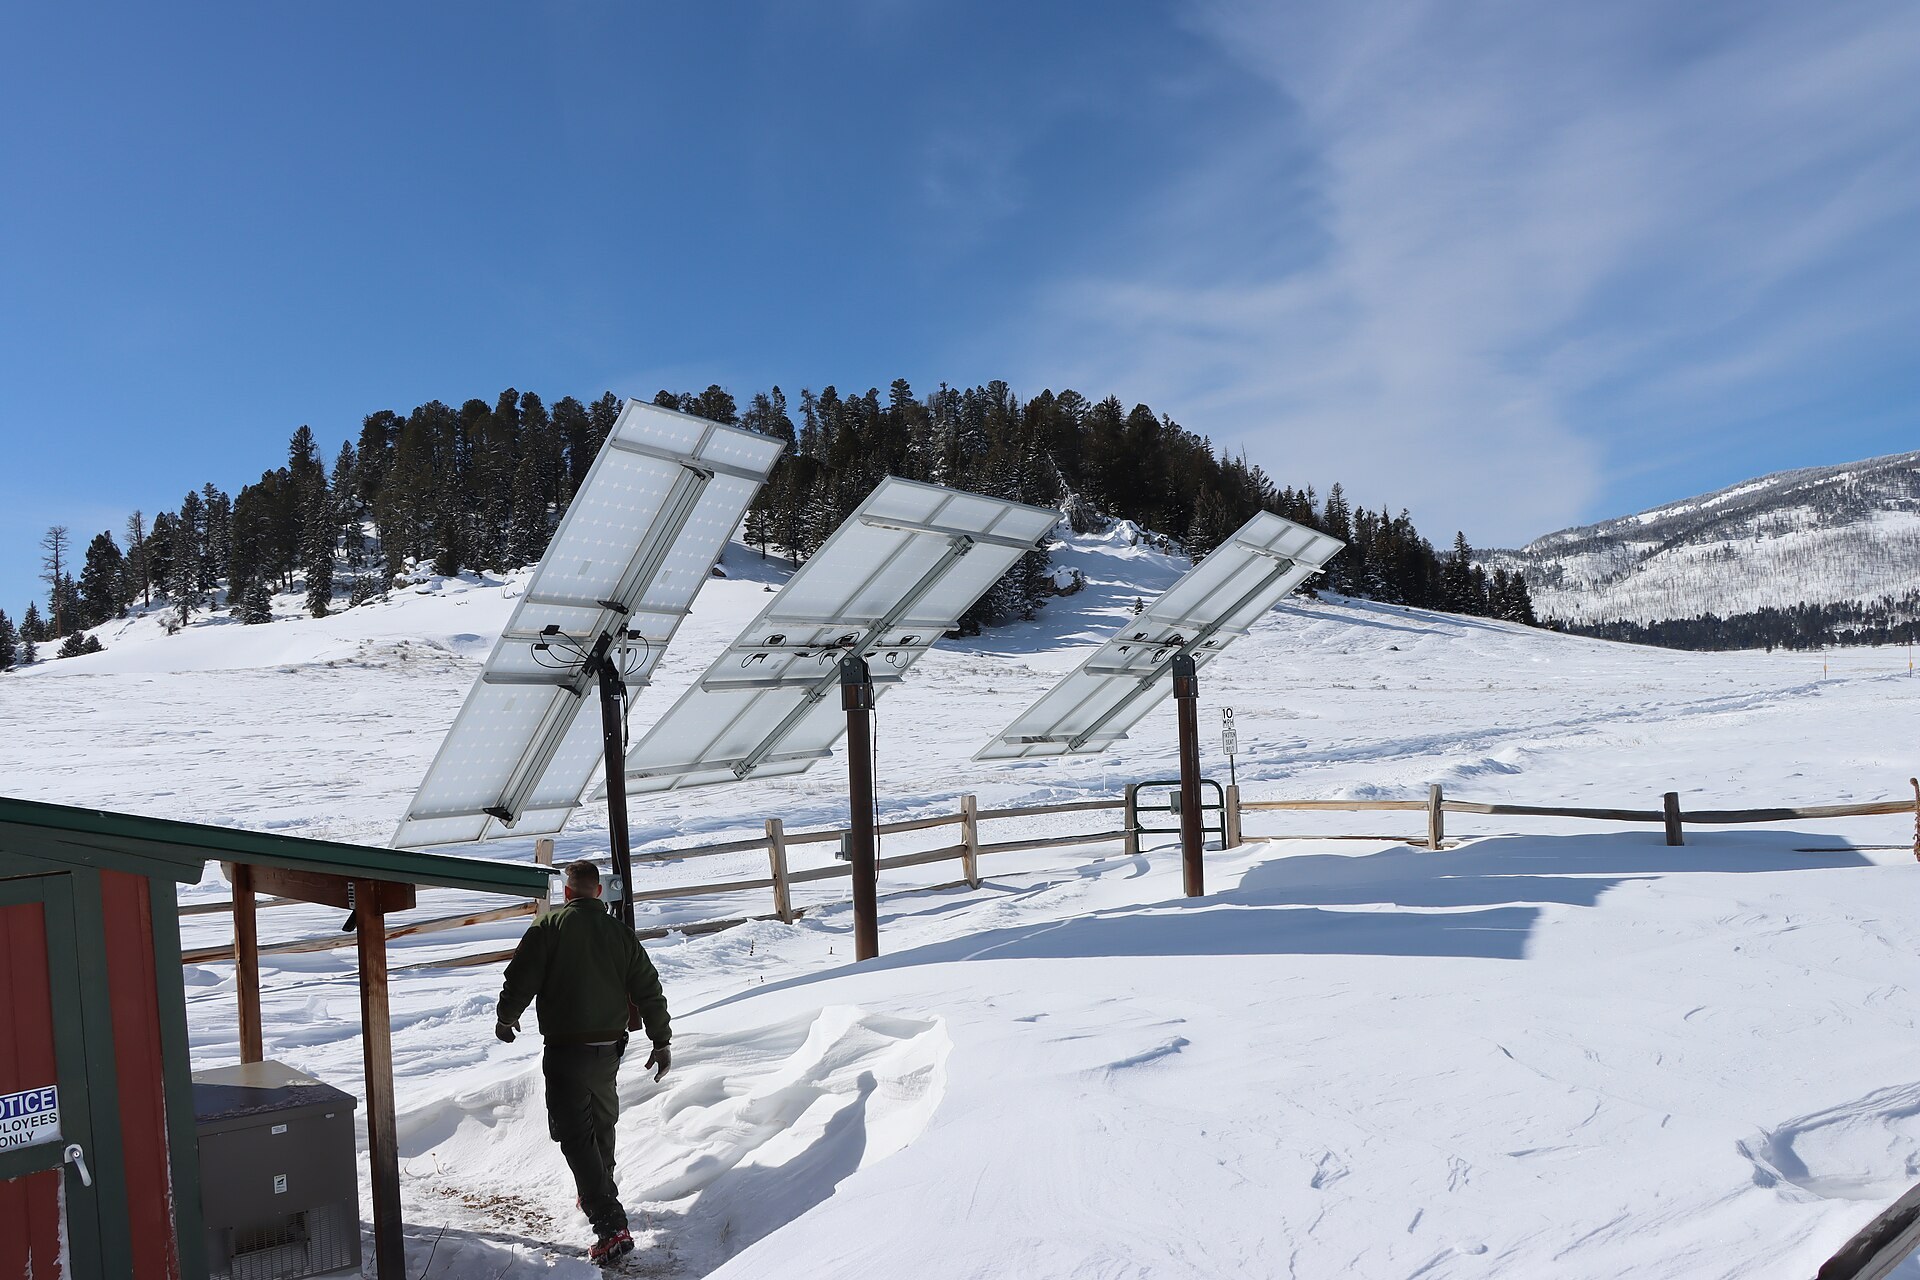
Standing the array up partially reverses the season, and costs nothing but a taller rear support on the rack. A flat panel meets December light at a punishing angle. Across the 94 locations in our peak sun hours atlas, a winter tilt is worth a median of 2.03 times the flat-panel December figure, and 2.55 times at the eighteen points above 50 degrees north.
Two things fall out of that plateau. Going from flat to steep is worth roughly double at every latitude tested, and the exact angle hardly matters: anywhere from about 50 to 80 degrees lands within a few percent of the December best.

Latitude plus 15 is just a convenient point on a broad plateau, so round it to whatever your rack offers. A steep rack also sheds snow, which is a second reason to build one.
When the annual optimum is the wrong angle
Ask PVGIS or any grid-tied design tool for the optimal tilt and it returns the angle that maximizes the year's total. For a grid-tied array that is the right question: every kilowatt-hour is worth the same to the meter whatever month it arrived in.
Off-grid, kilowatt-hours are not interchangeable. A June surplus is worth nothing, being curtailed already. A December one is worth whatever you would otherwise burn fuel to make.
| Site | Annual-optimum tilt | Winter tilt latitude + 15° | December gain from the steeper tilt | Annual cost of the steeper tilt |
|---|---|---|---|---|
| Phoenix | 33° | 48° | +10% | −3% |
| Denver | 38° | 55° | +11% | −4% |
| Madrid | 37° | 55° | +12% | −4% |
| Seattle | 37° | 63° | +14% | −8% |
PVGIS fixed-array output at 14% system losses, same databases as the sizing table above, retrieved 2 September 2026. The annual-optimum angle is PVGIS's own optimization for maximum yearly total.
A tenth to a seventh more power in the month that decides the system, for a few percent of a yearly total you were going to waste anyway. A hybrid house can keep the annual optimum, because it still has the grid to lean on in January.
The generator-in-December trade
North of about 45 degrees, sizing purely on December stops being obviously right.
Take the Seattle household. On December it needs 4.88 kW; on the annual average, 2.32 kW. The difference of 2.56 kW is about six 450-watt panels, plus rack, wire and charge-controller headroom.
That is roughly 130 square feet of extra glass looking for a clear patch of ground or roof.
That is roughly 12 square meters of extra glass looking for a clear patch of ground or roof.
Run the smaller array and December falls short. At 1.64 peak sun hours and 25% losses, 2.32 kW makes about 2.85 kWh a day against a 6 kWh load: a gap of 3.15 kWh a day, or about 98 kWh across the month.
A 3 kW inverter generator at half load makes 1.5 kW on the 0.32 gallons an hour in our generator fuel consumption chart: 4.7 kWh per gallon at the outlet, about 4.2 kWh into the bank after the charger. December's shortfall is then roughly 23 gallons, and a full winter with its shoulders 50 to 70 gallons, every year.
A 3 kW inverter generator at half load makes 1.5 kW on the 1.23 liters an hour in our generator fuel consumption chart: 1.22 kWh per liter at the outlet, about 1.1 kWh into the bank after the charger. December's shortfall is then roughly 89 liters, and a full winter with its shoulders 190 to 265 liters, every year.
Six panels bought once, against a fuel run every winter and a machine that needs oil changes, monthly exercise and somewhere dry to sit. The panels are a capital cost; the generator is a capital cost plus a standing order.
There is a floor under this. In Seattle's worst December week the array produces almost nothing regardless of size, and no panel count bridges a five-day stretch that delivers a tenth of the month's average. That is where a generator becomes the only answer, the case laid out in whether an off-grid system still needs a generator.
Where the arithmetic runs out
Tromsø sits at 69.6 degrees north, above the Arctic Circle, and the sun does not clear the horizon there from about 26 November to 15 January. PVGIS returns 0.00 for December in-plane irradiation, and that is not rounding.
Divide a load by zero and no array size works. The design month does not fail gracefully at that latitude; it stops applying. The shape of the year on a 60-degree tilt:
| Month | Nov | Dec | Jan | Feb | Mar | Apr | May | Jun |
|---|---|---|---|---|---|---|---|---|
| kWh per day per kW installed | 0.04 | 0.00 | 0.00 | 0.66 | 2.54 | 3.97 | 4.02 | 3.31 |
PVGIS 5.3 on ERA5, 2005–2023, fixed array at 60 degrees facing south, 14% system losses. Retrieved 2 September 2026.
March through September is a genuinely productive solar site: May delivers 4.02 kWh a day per installed kilowatt, against 3.73 for a winter-tilted array in Madrid in December. November through January is not a solar site at all.
High-latitude homes answer this with wind, micro-hydro, a generator or a heat source that is not electric, and treat the array as a nine-month machine. It is the one case where sizing on the design month is the wrong instruction, because the design month has nothing in it.
Cold adds a second constraint. Battery University gives the permissible charge window for lithium-ion, lithium iron phosphate included, and puts no charge at all below freezing, so an unheated battery box can refuse what little charge the array offers.
That window is 32 to 113 degrees Fahrenheit. Below 32, charging plates metallic lithium on the anode and takes capacity away permanently.
That window is 0 to 45 degrees Celsius. Below 0, charging plates metallic lithium on the anode and takes capacity away permanently.
Putting your own site through it
- Get your daily load in kilowatt-hours from a real appliance list.
- Look up your December figure — not the annual one — in the peak sun hours atlas, which carries it for all 50 US states and 43 European countries.
- Put both into the off-grid solar sizing calculator and read off the array.
- Take the days of autonomy for your state or country and size the bank on that, not on the array.
- Tilt the rack somewhere between 50 and 75 degrees if you are north of 40, and let the exact angle go.
One warning applies to every dataset of this kind: a satellite grid cell knows nothing about the ridge to your south. Shade the June sun clears easily lands straight across an array in December, when the sun peaks 40 degrees lower.
The cells behind these numbers are tens of miles across, so the figure describes your valley rather than your yard. Walk the site at midday near the solstice, because that is the one measurement no database hands you.
The cells behind these numbers are tens of kilometers across, so the figure describes your valley rather than your yard. Walk the site at midday near the solstice, because that is the one measurement no database hands you.
Common questions
Is the design month always December?
In the northern hemisphere it nearly always is. Across the 94 locations in our peak sun hours atlas, December was the darkest month at every one, from Honolulu at 21 degrees north to Reykjavik at 64. Some coastal sites run a close second month, so check your own coordinates. South of the equator the logic points at June.
Can I just add batteries instead of panels?
Only up to a point, because the two substitute along a curve that flattens fast. Our battery autonomy report sweeps array size at 90 locations: a median of 6.7 days of storage at an array sized to the darkest-month average, 2.9 days at a 25% margin, 1.9 days at 50%. Past that no amount of battery makes energy that was never collected.
What if my winter load is higher than my summer load?
Then the gap is worse than these tables show, since they assume a flat load all year. Electric heating, longer lighting hours and more indoor time push December consumption up in the same weeks production falls. Run your load audit on a December week and size against that.
Does snow on the panels change the sizing?
It changes the tilt decision more than the sizing. A covered panel produces nothing, so a steep winter tilt earns its keep twice: better geometry for low sun, and a surface snow slides off. Keep the bottom edge of a ground mount clear of the drift line.
Sources: Photovoltaic Geographical Information System 5.3 (CM SAF SARAH-3 and ERA5, 2005–2023) and 5.2 (NREL National Solar Radiation Database, 2005–2015), Joint Research Center, European Commission; monthly and hourly series retrieved 2 September 2026.
NASA POWER all-sky irradiance, 2001–2020 (CERES SYN1deg), NASA Langley Research Center, by way of the Grid CEO battery autonomy report. Battery University on lithium charge temperature limits. Fuel burn from the Grid CEO generator fuel consumption chart.